
By The Numbers
Month-To-Date: 6.61%
Quarter-To-Date: 9.38%
Year-To-Date: 14.32%
1 Year: 22.09%
Since Inception (Annualized): 23.88%
Investment Objective
Growth
Inception: 01/04/2017
All data for this report is as of 08/31/2018

James Adams
Portfolio Manager
Equity Trend Post Strong Month for August
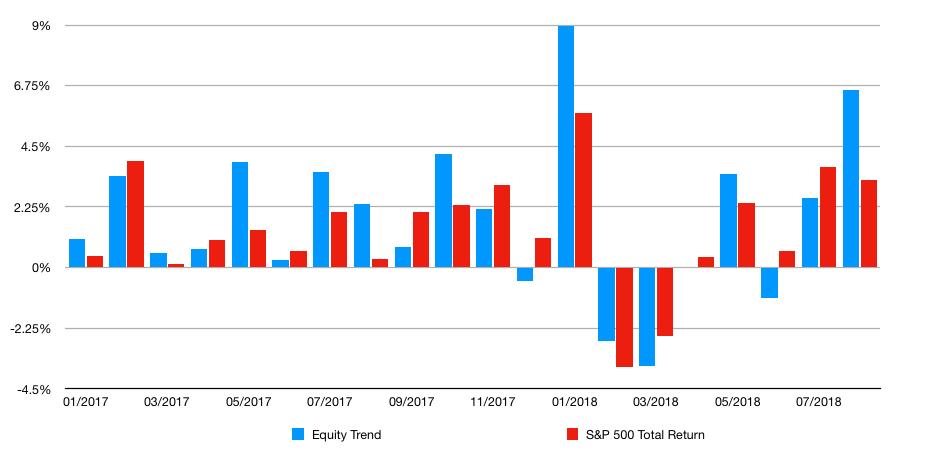
Month in Review: The Equity Trend Model made up for a slight underperformance in July with a strong performance in August. The S&P 500 Total Return Index was up 3.37% in August while Equity Trend finished up 6.61% nearly doubling the return of the index for the month. While a portion of the performance of the model was attributed to a strong broader market, six of the positions in the model posted double digit returns – Square, Inc. (SQ): 37.05%, Apple Inc (AAPL): 20.03%, NVIDIA (NVDA): 14.63%, TJX Companies Inc. (TJX) 13.07%, Intuitive Surgical Inc. (ISRG): 10.20% and Salesforce.com Inc. (CRM): 11.32% and only three of the positions posted negative returns – Alibaba Group (BABA): -6.53%, JPMorgan Chase and Co.(JPM): -0.40%, Constellation Brands (STZ): -0.61%.
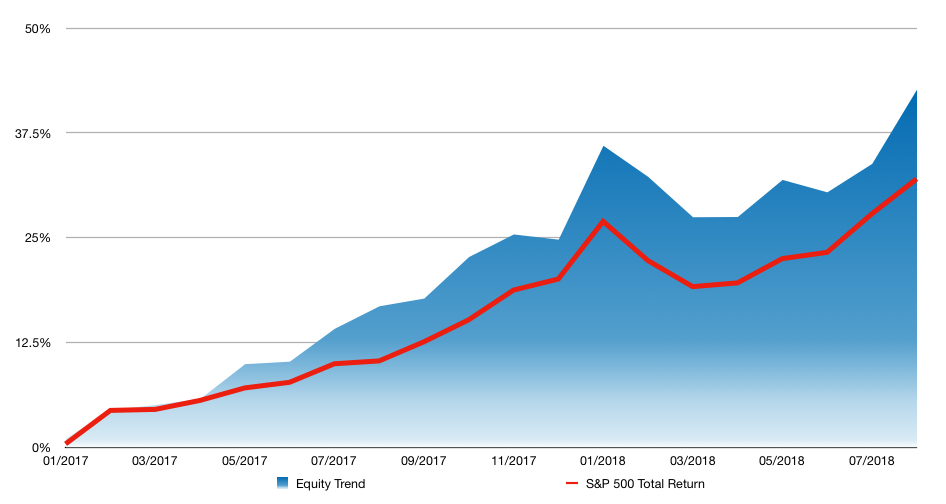
With the month’s performance in the books, Equity Trend is now outperforming the S&P 500 Total Return Index by 10.63% since inception based upon cumulative return with the model finishing the month at 42.65% versus 32.02% for the index.
About the model: Adams Wealth Management’s Equity Trend Model is a quantitative, trend-following model portfolio that invests in up to 25 individual equities. Our rules-driven model takes a risk-on/risk-off approach to investing focusing on stocks that are appreciating in price as the broader market trends higher. When the broader market is trending lower, the model will invest in fixed-income ETFs (exchange-traded funds) or a basket of fixed-income ETFs. The investment objective of this model is growth and may not be suitable for all investors. For purposes of comparison, this report uses the S&P 500 Total Return Index. For more information about this model, please read our disclosures.
Cumulative Return Since Inception
Return by Month
Book your FREE Portfolio Management Strategy Session
Ins and Outs: Despite the solid month in July, the model exited four positions as a result of the model’s exit rules. Netflix (NFLX), Northrup Grumman Corp (NOC), Raytheon Company (RTN), and FedEx Corporation (FDX) all signaled trend reversals in July and where subsequently removed from the model during the August rebalancing. These positions were replaced with four new members that created new highs in July and were added to the model during August: Marathon Oil Corp. (MRO), Archer-Daniels-Midland Corp (ADM), SYSCO Corp (SYY), and First Data Corp (FDC).
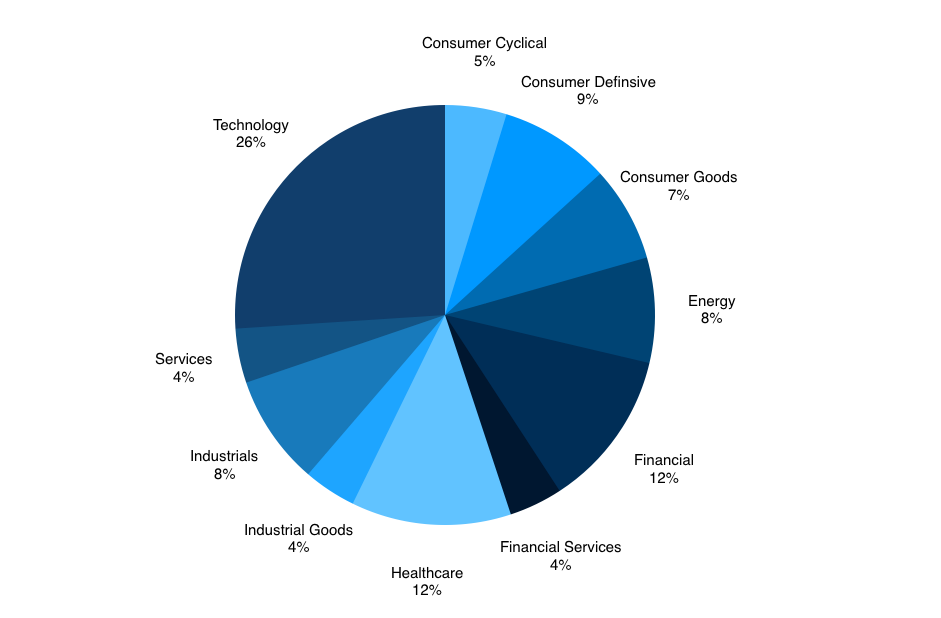
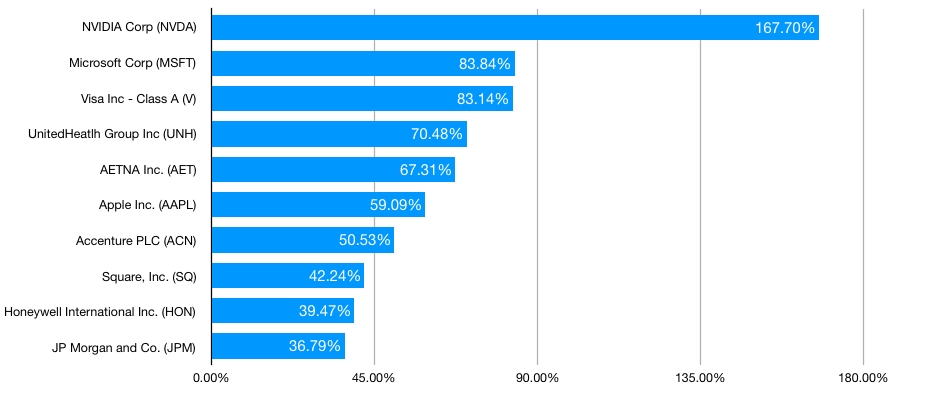
Even though the portfolio rebalancing resulted in one fewer position allocated towards the technology sector, the total allocation to technology grew as a result of a strong month from Square Inc. (SQ), Apple Inc. (AAPL) and NVIDIA Corp. (NVDA) pushing Square Inc. and Apple Inc. into the Top Ten Holdings by Cumulative Return while NVIDIA Corp retains it’s position at the top.
Sector Allocation
Top 10 Current Holdings by Cumulative Return
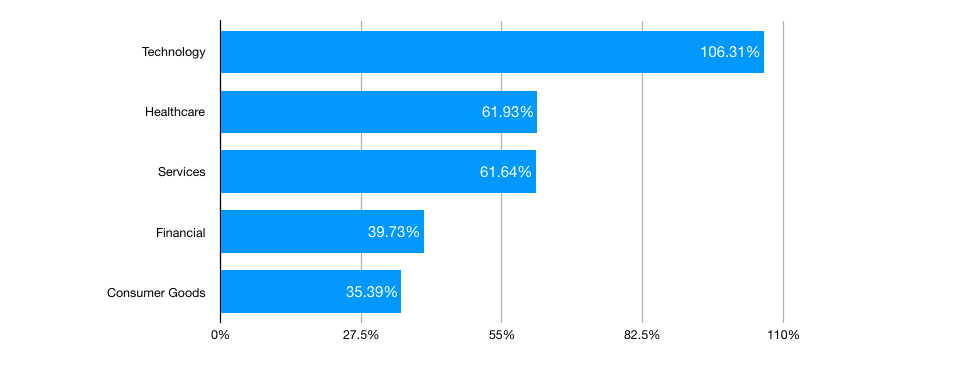
Top 5 Current Sectors by Cumulative Return
Disclosures
This information provided is an investment model and does not reflect actual client(s) performance. This model may not be suitable for all investors. Adams Wealth Management seeks to provide investments suitable for all of our clients. As a result, many if not all of our clients will own varying allocations to this and/or other models. Clients with different objects have different results portrayed from this model.
The information provided is net of fees (1.5%). In addition, the results of this model reflect divided payments and other income from investments made.
The Standard & Poor’s 500 Total Return Index (S&P 500 Total Return) measures the total return including distributions of the Standard and Poor’s 500 Index (S&P 500). The S&P 500 is an unmanaged, market capitalization weighted index of 500 widely held stocks. The index is composed of 500 constituent companies and is often used as a benchmark for the U.S. stock market. Please note that investors cannot directly invest in an index.
All investing involves risk, including the potential for loss of principal. There is no guarantee this model will be successful.
