By The Numbers

Month-To-Date: 1.27%

Quarter-To-Date: 10.77%

Year-To-Date: 15.77%

1 Year: 22.68%

Since Inception (Annualized): 23.51%

Investment Objective

Growth

Inception: 01/04/2017

All data for this report is as of 09/30/2018

James Adams

James Adams

Portfolio Manager

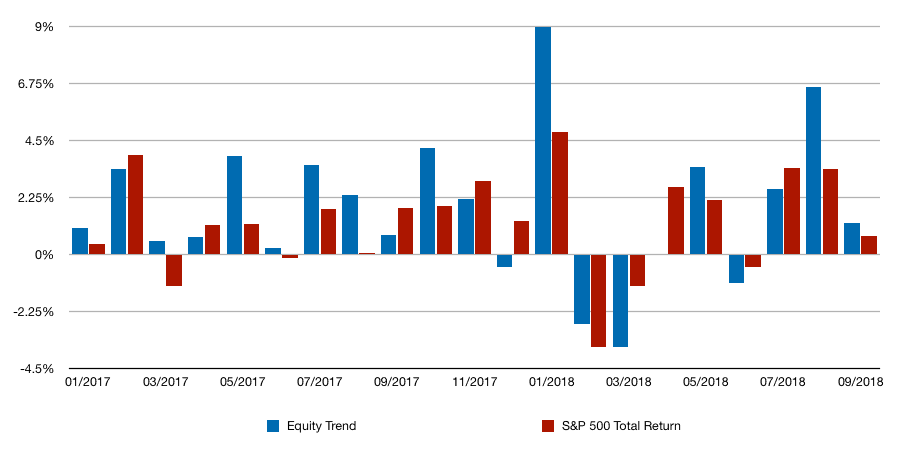
Equity Trend Post Strong Month for August

Month in Review: Equity Trend followed up its strong strong month in August with a positive return for September gaining 1.27%. The S&P 500 Total Return posted a modest gain of 0.73%. The market’s positive performance largely contributed to the monthly return for the model. The top three performers for the model were Square (SQ): 11.55%, Marathon Oil Corp. (MRO) 8.46%, and Honeywell International Inc. (HON): 5.10%. While First Data Corp (FDC): -4.88%, Valero Energy Corp (VLO): -2.85%, and Sysco Corp (SYY): -2.13% were the three worst performing holdings for the model.

The Equity Trend Model now closes the third quarter of 2018 with a cumulative return since inception of 44.46% versus the S&P 500 Total Return Index of 32.77% for the same time period.

About the model: Adams Wealth Management’s Equity Trend Model is a quantitative, trend-following model portfolio that invests in up to 25 individual equities. Our rules-driven model takes a risk-on/risk-off approach to investing focusing on stocks that are appreciating in price as the broader market trends higher. When the broader market is trending lower, the model will invest in fixed-income ETFs (exchange-traded funds) or a basket of fixed-income ETFs. The investment objective of this model is growth and may not be suitable for all investors. For purposes of comparison, this report uses the S&P 500 Total Return Index. For more information about this model, please read our disclosures.

<h4 class="piechartheader"><center>Cumulative Return Since Inception</center></h4><!-- [et_pb_line_break_holder] --><html><!-- [et_pb_line_break_holder] --> <head><!-- [et_pb_line_break_holder] --> <script type="text/javascript" src="https://www.gstatic.com/charts/loader.js"></script><!-- [et_pb_line_break_holder] --> <script type="text/javascript"><!-- [et_pb_line_break_holder] --> google.charts.load('current', {'packages':['corechart']});<!-- [et_pb_line_break_holder] --> google.charts.setOnLoadCallback(drawVisualization);<!-- [et_pb_line_break_holder] --><!-- [et_pb_line_break_holder] --> function drawVisualization() {<!-- [et_pb_line_break_holder] --> // Some raw data (not necessarily accurate)<!-- [et_pb_line_break_holder] --> var data = google.visualization.arrayToDataTable([<!-- [et_pb_line_break_holder] --> ['Month', 'Equity Trend', 'S&P 500 Total Return'],<!-- [et_pb_line_break_holder] --> ['2017/01', 1.07, .044],<!-- [et_pb_line_break_holder] --> ['2017/02', 4.49, 4.43],<!-- [et_pb_line_break_holder] --> ['2017/03', 5.07, 4.55],<!-- [et_pb_line_break_holder] --> ['2017/04', 5.80, 5.62],<!-- [et_pb_line_break_holder] --> ['2017/05', 9.94, 7.11],<!-- [et_pb_line_break_holder] --> ['2017/06', 10.24, 7.78],<!-- [et_pb_line_break_holder] --> ['2017/07', 14.15, 9.99],<!-- [et_pb_line_break_holder] --> ['2017/08', 16.84, 10.33],<!-- [et_pb_line_break_holder] --> ['2017/09', 17.76, 12.61],<!-- [et_pb_line_break_holder] --> ['2017/10', 22.71, 15.23],<!-- [et_pb_line_break_holder] --> ['2017/11', 25.40, 18.77],<!-- [et_pb_line_break_holder] --> ['2017/12', 24.78, 20.09],<!-- [et_pb_line_break_holder] --> ['2018/01', 35.97, 26.96],<!-- [et_pb_line_break_holder] --> ['2018/02', 32.26, 22.29],<!-- [et_pb_line_break_holder] --> ['2018/03', 27.45, 19.18],<!-- [et_pb_line_break_holder] --> ['2018/04', 27.48, 19.63],<!-- [et_pb_line_break_holder] --> ['2018/05', 31.90, 22.52],<!-- [et_pb_line_break_holder] --> ['2018/06', 30.42, 23.27],<!-- [et_pb_line_break_holder] --> ['2018/07', 33.81, 27.86],<!-- [et_pb_line_break_holder] --> ['2018/08', 42.65, 32.02],<!-- [et_pb_line_break_holder] --> ['2018/09', 44.46, 32.77]<!-- [et_pb_line_break_holder] --> ]);<!-- [et_pb_line_break_holder] --><!-- [et_pb_line_break_holder] --> var options = {<!-- [et_pb_line_break_holder] --> legend: { position: 'bottom'},<!-- [et_pb_line_break_holder] --> vAxis: {title: 'Return %'},<!-- [et_pb_line_break_holder] --> hAxis: {title: 'Month'},<!-- [et_pb_line_break_holder] --> seriesType: 'line',<!-- [et_pb_line_break_holder] --> series: {0: {type: 'area'}}<!-- [et_pb_line_break_holder] --> };<!-- [et_pb_line_break_holder] --><!-- [et_pb_line_break_holder] --> var chart = new google.visualization.ComboChart(document.getElementById('chart_div'));<!-- [et_pb_line_break_holder] --> chart.draw(data, options);<!-- [et_pb_line_break_holder] --> }<!-- [et_pb_line_break_holder] --> </script><!-- [et_pb_line_break_holder] --> </head><!-- [et_pb_line_break_holder] --> <body><!-- [et_pb_line_break_holder] --> <div id="chart_div" style="width: 900px; height: 500px;"></div><!-- [et_pb_line_break_holder] --> </body><!-- [et_pb_line_break_holder] --></html>

Return by Month

Book your own FREE Strategy Session

Ins and Outs: The model had a low turnover for the month as expected by the previous month’s strong returns. However, Alibaba Group (BABA) closed the previous month below the model’s exit signal communicating a trend reversal. As a result, the model exited Alibaba Group. We replaced that position with Medtronic PLC (MDT) as the company created another new high during the previous month.

<h4 class="piechartheader"><center>Sector Allocation</center></h4><!-- [et_pb_line_break_holder] --><html><!-- [et_pb_line_break_holder] --> <head><!-- [et_pb_line_break_holder] --> <title>Google Charts Tutorial</title><!-- [et_pb_line_break_holder] --> <script type = "text/javascript" src = "https://www.gstatic.com/charts/loader.js"><!-- [et_pb_line_break_holder] --> </script><!-- [et_pb_line_break_holder] --> <script type = "text/javascript"><!-- [et_pb_line_break_holder] --> google.charts.load('current', {packages: ['corechart']}); <!-- [et_pb_line_break_holder] --> </script><!-- [et_pb_line_break_holder] --> </head><!-- [et_pb_line_break_holder] --><!-- [et_pb_line_break_holder] --> <body><!-- [et_pb_line_break_holder] --> <div id = "container" style = "width: '100%'; height: '100%'; margin: 0 auto"><!-- [et_pb_line_break_holder] --> </div><!-- [et_pb_line_break_holder] --> <script language = "JavaScript"><!-- [et_pb_line_break_holder] --> function drawChart() {<!-- [et_pb_line_break_holder] --> // Define the chart to be drawn.<!-- [et_pb_line_break_holder] --> var data = new google.visualization.DataTable();<!-- [et_pb_line_break_holder] --> data.addColumn('string', 'Browser');<!-- [et_pb_line_break_holder] --> data.addColumn('number', 'Percentage');<!-- [et_pb_line_break_holder] --> data.addRows([<!-- [et_pb_line_break_holder] --> ['Technology', 25.18],<!-- [et_pb_line_break_holder] --> ['Utilities', 3.84],<!-- [et_pb_line_break_holder] --> ['Consumer Cyclical', 4.01],<!-- [et_pb_line_break_holder] --> ['Consumer Defensive', 7.70],<!-- [et_pb_line_break_holder] --> ['Consumer Goods', 7.92],<!-- [et_pb_line_break_holder] --> ['Energy', 7.73],<!-- [et_pb_line_break_holder] --> ['Financial', 11.80],<!-- [et_pb_line_break_holder] --> ['Financial Services', 3.83],<!-- [et_pb_line_break_holder] --> ['Healthcare', 16.33],<!-- [et_pb_line_break_holder] --> ['Industrials', 7.61],<!-- [et_pb_line_break_holder] --> ['Industrial Goods', 4.05],<!-- [et_pb_line_break_holder] --> ]);<!-- [et_pb_line_break_holder] --> <!-- [et_pb_line_break_holder] --> // Set chart options<!-- [et_pb_line_break_holder] --> var options = {<!-- [et_pb_line_break_holder] --> pieSliceText: 'none',<!-- [et_pb_line_break_holder] --> legend: { position: 'labeled'},<!-- [et_pb_line_break_holder] --> colors: ['#56C1FF', '#00A2FF', '#0076BA', '#004D7F', '#003462', '#001837', '#6DC9FF', '#22AEFF', '#1A85C3', '#145F90', '#001837' ],<!-- [et_pb_line_break_holder] --> 'width':900,<!-- [et_pb_line_break_holder] --> 'height':400<!-- [et_pb_line_break_holder] --> <!-- [et_pb_line_break_holder] --> };<!-- [et_pb_line_break_holder] --><!-- [et_pb_line_break_holder] --> // Instantiate and draw the chart.<!-- [et_pb_line_break_holder] --> var chart = new google.visualization.PieChart(document.getElementById('container'));<!-- [et_pb_line_break_holder] --> chart.draw(data, options);<!-- [et_pb_line_break_holder] --> }<!-- [et_pb_line_break_holder] --> google.charts.setOnLoadCallback(drawChart);<!-- [et_pb_line_break_holder] --> </script><!-- [et_pb_line_break_holder] --> </body><!-- [et_pb_line_break_holder] --></html>
<h4 class="piechartheader"><center>Top 10 Current Holdings by Cumulative Return</center></h4><!-- [et_pb_line_break_holder] --> <script type="text/javascript"><!-- [et_pb_line_break_holder] --> google.charts.load("current", {packages:["corechart"]});<!-- [et_pb_line_break_holder] --> google.charts.setOnLoadCallback(drawChart);<!-- [et_pb_line_break_holder] --> function drawChart() {<!-- [et_pb_line_break_holder] --> var data = google.visualization.arrayToDataTable([<!-- [et_pb_line_break_holder] --> ["Stock", "Cumulative Return", { role: "style" } ],<!-- [et_pb_line_break_holder] --> ["NVIDIA Corp", 168.07, "#0076BA"],<!-- [et_pb_line_break_holder] --> ["Microsoft Corp", 87.83, "#0076BA"],<!-- [et_pb_line_break_holder] --> ["Visa Inc. A", 87.40, "#0076BA"],<!-- [et_pb_line_break_holder] --> ["Aetna Inc.", 69.46, "#0076BA"],<!-- [et_pb_line_break_holder] --> ["UnitedHealth Group Inc.", 69.41, "#0076BA"],<!-- [et_pb_line_break_holder] --> ["Square Inc.", 58.67, "#0076BA"],<!-- [et_pb_line_break_holder] --> ["Apple Inc.", 57.61, "#0076BA"],<!-- [et_pb_line_break_holder] --> ["Accenture PLC.", 51.47, "#0076BA"],<!-- [et_pb_line_break_holder] --> ["Honeywell International Inc.", 46.59, "#0076BA"],<!-- [et_pb_line_break_holder] --> ["JPMorgan Chase and Co.", 34.65, "#0076BA"]<!-- [et_pb_line_break_holder] --> ]);<!-- [et_pb_line_break_holder] --><!-- [et_pb_line_break_holder] --> var view = new google.visualization.DataView(data);<!-- [et_pb_line_break_holder] --> view.setColumns([0, 1,<!-- [et_pb_line_break_holder] --> { calc: "stringify",<!-- [et_pb_line_break_holder] --> sourceColumn: 1,<!-- [et_pb_line_break_holder] --> type: "string",<!-- [et_pb_line_break_holder] --> role: "annotation" },<!-- [et_pb_line_break_holder] --> 2]);<!-- [et_pb_line_break_holder] --><!-- [et_pb_line_break_holder] --> var options = {<!-- [et_pb_line_break_holder] --> hAxis: {title: 'Return %'},<!-- [et_pb_line_break_holder] --> width: 1200,<!-- [et_pb_line_break_holder] --> height: 800,<!-- [et_pb_line_break_holder] --> bar: {groupWidth: "75%"},<!-- [et_pb_line_break_holder] --> legend: { position: "none" },<!-- [et_pb_line_break_holder] --> };<!-- [et_pb_line_break_holder] --> var chart = new google.visualization.BarChart(document.getElementById("barchart_values"));<!-- [et_pb_line_break_holder] --> chart.draw(view, options);<!-- [et_pb_line_break_holder] --> }<!-- [et_pb_line_break_holder] --> </script><!-- [et_pb_line_break_holder] --><div id="barchart_values" style="width: 1200px; height: 800px;"></div>

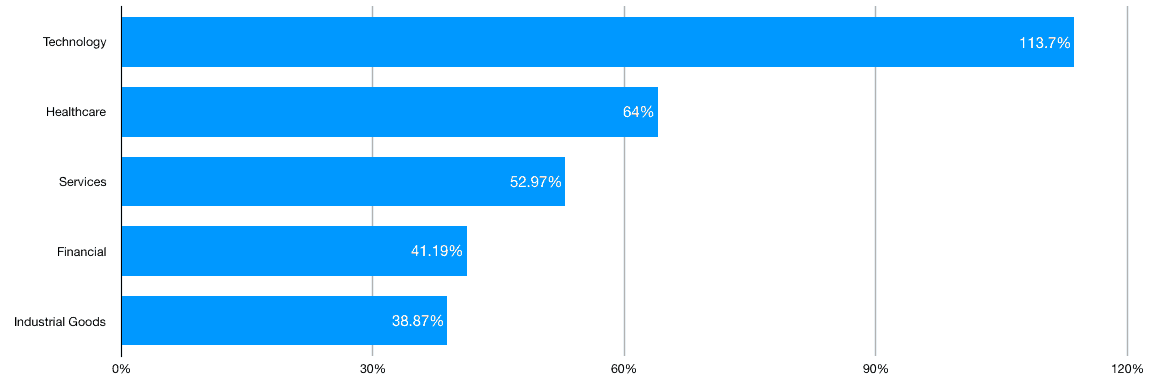
Top 5 Current Sectors by Cumulative Return

Disclosures

This information provided is an investment model and does not reflect actual client(s) performance. This model may not be suitable for all investors. Adams Wealth Management seeks to provide investments suitable for all of our clients. As a result, many if not all of our clients will own varying allocations to this and/or other models. Clients with different objects have different results portrayed from this model.

The information provided is net of fees (1.5%). In addition, the results of this model reflect divided payments and other income from investments made.

The Standard & Poor’s 500 Total Return Index (S&P 500 Total Return) measures the total return including distributions of the Standard and Poor’s 500 Index (S&P 500). The S&P 500 is an unmanaged, market capitalization weighted index of 500 widely held stocks. The index is composed of 500 constituent companies and is often used as a benchmark for the U.S. stock market. Please note that investors cannot directly invest in an index.

All investing involves risk, including the potential for loss of principal. There is no guarantee this model will be successful.

September 2018 Equity Trend Report ultima modifica: 2018-10-19T14:50:04-05:00 da Adams Wealth Management

Get in Touch

600 S Tyler St #2100
Amarillo TX 79101

Other Information:

Adams Wealth Management Group LLC (“Adams Wealth Management”) is a registered investment adviser offering advisory services in the State of Texas and in other jurisdictions where exempted. Registration does not imply a certain level of skill or training. The presence of this website on the Internet shall not be directly or indirectly interpreted as a solicitation of investment advisory services to persons of another jurisdiction unless otherwise permitted by statute. Follow-up or individualized responses to consumers in a particular state by Adams Wealth Management in the rendering of personalized investment advice for compensation shall not be made without our first complying with jurisdiction requirements or pursuant an applicable state exemption.

All written content on this site is for information purposes only. Opinions expressed herein are solely those of Adams Wealth Management, unless otherwise specifically cited. Material presented is believed to be from reliable sources and no representations are made by our firm as to another parties’ informational accuracy or completeness. All information or ideas provided should be discussed in detail with an advisor, accountant or legal counsel prior to implementation.

All investing involves risk, including the potential for loss of principal. There is no guarantee that any investment strategy or plan will be successful.

Share This