
QUOTE OF THE QUARTER
“I’m an optimist. It does not seem too much use being anything else.”
– Winston Churchill
QUARTERLY TIP
Study the I.R.S. hobby loss rules if you want to write off self-employment losses. You may regard your venture as a business activity or a trade, but the I.R.S. may deem it a pastime you simply take part in for personal pleasure.
THE QUARTER IN BRIEF
The opening quarter of 2017 was a historic one for Wall Street as the Dow Jones Industrial Average topped 20,000 for the first time. Equities rallied through January and February, then lost momentum in March; even so, the S&P 500 had gained 5.53% YTD when the quarter ended. The Federal Reserve raised the federal funds rate for only the third time in a decade, in response to strengthening inflation pressure and other signals of economic acceleration. Consumer confidence remained high. Commodities had a decidedly mixed quarter. New home sales improved, while existing home sales tapered off. The U.K. took another step toward its Brexit; the U.S. left the Trans-Pacific Partnership. Wall Street kept its hopes up for tax reform and lighter business and banking industry regulation.(1,2)
DOMESTIC ECONOMIC HEALTH
As the stock market climbed, so did the Conference Board’s consumer confidence index. By March, it had reached an astonishingly high mark of 125.6. The University of Michigan’s household sentiment index declined from 98.5 to 96.9 across the quarter, but it remained well above its historical average of 86.0.(3,4)
Factory and service sectors expanded nicely during Q1, according to the Institute for Supply Management. The Arizona-based organization’s manufacturing purchasing manager index was at 56.0 in January, 57.7 in February, and 57.2 in March. Its service sector PMI (the March number was not available at this writing) came in at 56.5 in January and 57.6 in February. All these numbers indicate solid growth.(5,6)
One other sign of economic growth, of course, is inflation. In Q1, it became more palpable. By February, the Consumer Price Index had risen 2.7% in a year (the annualized advance on the core CPI was 2.2%). Producer prices were up as well. The headline PPI showed a 2.2% yearly advance in February, with core prices gaining 1.5% over 12 months.(3)
Currently available data shows tepid consumer spending at the beginning of 2017. Personal spending was up just 0.2% in the opening month of the year and only 0.1% in February. Consumer incomes, however, rose 0.5% in January, then 0.4% in February. Households sent headline retail sales 0.6% higher in January, but only 0.1% a month later. There were gains in durable goods orders in both January (2.3%) and February (1.7%).(3,7)
January’s Department of Labor jobs report showed the headline jobless rate at 4.8% and the U-6 rate measuring underemployment at 9.4%; a month later, those unemployment rates were respectively lower at 4.7% and 9.2%. Hiring was strong in both January and February, with 238,000 net new jobs added to payrolls in the first month and 235,000 net new jobs added in the second.(8)
All this data encouraged the Federal Reserve to make its first interest rate move of the year. On March 15, it announced a widely expected, quarter-point hike, taking the federal funds rate to a target range of 0.75-1.00%. As Fed chair Janet Yellen told the media after the policy announcement, “The simple message is, the economy is doing well.” Investors who assumed the hike was coming scrutinized the Fed’s dot-plot forecast for any 2017 changes; they did not find any. Two incremental rate increases are still projected before the year ends.(9)
Elsewhere in Washington, President Donald Trump signed an executive order commissioning a review of the Dodd-Frank Act. As Q1 ended, hearings on portions of Dodd-Frank were set to start in early April, with a chance of reform legislation being introduced in Congress during Q2.(10)
GLOBAL ECONOMIC HEALTH
In late March, the United Kingdom formally triggered Article 50 of the Lisbon Treaty – the beginning of the Brexit, if you will. It now has until April 2019 to negotiate the terms of its departure from the European Union. Will it retain single market access after the Brexit, so that its citizens can keep working and living in other E.U. countries without visas? Or will it make a “hard” Brexit, a divorce dictated by court decisions and/or World Trade Organization rules that would cause its people to lose E.U. citizenship rights? In April, the negotiations begin. The euro area jobless rate stood at 9.5% as of February, a low unseen since May 2009. Eurostat estimated an inflation rate of 1.5% for the euro area for March, an 0.5% decline from February.(11,12)
As the United States left the Trans-Pacific Partnership during the quarter, Asia-Pacific nations seeking a regional trade pact turned to Plan B – Plan B being the Regional Comprehensive Economic Partnership. This free trade agreement, now in negotiation, would bring China, Japan, and India into an economic accord with 13 other Asia-Pacific neighbors, including some of the region’s poorest nations, such as Myanmar and Laos. Asia-Pacific manufacturing purchasing manager indices improved as Q1 ended, with China’s official PMI advancing 0.2 points to 51.8 in March for its best reading since April 2012. Japanese and Indian factory activity also accelerated in March, with India’s PMI hitting a 5-month high.(13,14)
WORLD MARKETS
As of March 31, the five best YTD performers among consequential global stock indices were Argentina’s MERVAL at +19.8%, Spain’s IBEX 35 at +11.9%, India’s Sensex at +11.2%, the MSCI Emerging Markets at +11.1%, and Singapore’s Straits Times at +10.2%. There were other big quarterly gains: 7.9% for Brazil’s Bovespa, 7.2% for Germany’s DAX, 6.5% for Italy’s FTSE MIB, 6.4% for the Euro Stoxx 50, 6.3% for the Global Dow, 9.6% for Hong Kong’s Hang Seng, and 6.6% for South Korea’s Kospi.(15,16)
In fact, it is hard to find a marquee stock index that retreated in Q1. Scrutiny reveals two: Russia’s RTS slipped 3.3%, and Japan’s Nikkei 225 lost 1.1%. To round things out, China’s Shanghai Composite gained 3.8% in Q1; the United Kingdom’s FTSE 100, 2.5%; and the MSCI World, 5.9%.(15,16)
COMMODITIES MARKETS
For metals investors, the first quarter brought much to cheer about. Investors in soft commodities had less to celebrate.
Palladium had a great Q1, rising 17.46%; aluminum was not far behind at 14.87%. COMEX silver ended the quarter at $18.28, gaining 14.50%. COMEX gold futures advanced 8.64% to settle at $1,247.40. Lastly, copper gained 5.84%, and platinum, 5.21%. Cotton led the way in ag futures with a 9.46% Q1 improvement; rice was next with a gain of 5.77%. CBOT wheat futures rose 4.53%, while corn futures added 3.48%.(17,18)
The quarter also saw some double-digit drops. Orange juice futures stumbled 20.75%; natural gas, 14.85%; and sugar, 14.10%. Other setbacks occurred for heating oil (8.89%), soybean oil (7.67%), WTI crude (5.81%), soybeans (5.07%), tin (4.56%), oats (1.86%), cocoa (1.46%), and nickel (1.39%). Oil finished the quarter at a NYMEX price of $50.85.(17,18)
REAL ESTATE
Q: Did mortgage rates ascend or descend in the first quarter? A: They descended. On December 29, the average interest rate on a conventional home loan was 4.32%, according to Freddie Mac’s Primary Mortgage Market Survey. By the March 30 PMMS, it was just 4.14%. Similar declines were seen for the average rate on the refinancer’s favorite, the 15-year FRM (3.55% to 3.39%), and the average rate on the 5/1-year ARM (3.30% to 3.18%).(19,20)
Census Bureau data showed new home sales rising 5.3% in January and another 6.1% in February. Resales wavered, increasing 3.3% for January and decreasing 3.7% the next month, according to the National Association of Realtors.(3)
Regarding the sales numbers that matter most (the annualized ones), existing home sales were up 5.4% in the year ending in February; new home sales, 12.8%. In the second month of 2017, the median price for an existing home was up 7.7% from a year ago at $228,400. The median new home price was up at $329,900 as of December, but it had fallen to $296,200 by February.(21,22)
What did other key real estate indicators do in the quarter? Housing starts and building permits went in opposite directions. Starts fell 1.9% in January, then rose 3.0% a month later; permits advanced 4.6% for January, but retreated 6.2% in February. NAR’s pending home sales index rose 5.5% to 112.3 in February after slipping 2.8% in January. Finally, January’s 20-city S&P/Case-Shiller home price index arrived in late March, revealing an 0.2% monthly improvement and a 5.7% annualized advance.
(3)
LOOKING BACK…LOOKING FORWARD
On March 31, the key U.S. equity indices settled at these levels: Dow, 20,663.22; Nasdaq, 5,911.74; S&P 500, 2,362.72; Russell 2000, 1,385.92. The Russell did not quite gain as much as the big three in Q1 – it was up 2.12% YTD when March concluded. The CBOE VIX? It finished Q1 down 11.89% YTD – in fact, it was the worst performer among significant indices. The PHLX Housing Index was the quarter’s best performer, gaining 11.96%; the Nasdaq 100 was a close second, advancing 11.77%.(2)
Some truly remarkable things happened in Q1. The Dow closed at a record high for 12 straight trading days – a feat that last occurred in 1987. The blue chips also went on an 8-session losing streak for the first time since 2011. As the table below shows, the Nasdaq gained more in three months than it did during all of 2016.(1)
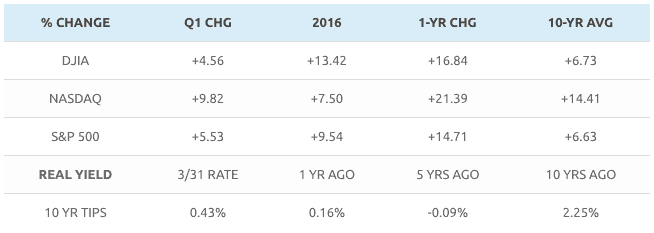
Indices are unmanaged, do not incur fees or expenses, and cannot be invested into directly. These returns do not include dividends. 10-year TIPS real yield = projected return at maturity given expected inflation.
This material was prepared by MarketingPro, Inc., and does not necessarily represent the views of the presenting party, nor their affiliates. The information herein has been derived from sources believed to be accurate. Please note – investing involves risk, and past performance is no guarantee of future results. Investments will fluctuate and when redeemed may be worth more or less than when originally invested. This information should not be construed as investment, tax or legal advice and may not be relied on for the purpose of avoiding any Federal tax penalty. This is neither a solicitation nor recommendation to purchase or sell any investment or insurance product or service, and should not be relied upon as such. Indices do not incur management fees, costs and expenses, and cannot be invested into directly. All economic and performance data is historical and not indicative of future results. The Dow Jones Industrial Average is a price-weighted index of 30 actively traded blue-chip stocks. The NASDAQ Composite Index is a market-weighted index of all over-the-counter common stocks traded on the National Association of Securities Dealers Automated Quotation System. The Standard & Poor’s 500 (S&P 500) is a market-cap weighted index composed of the common stocks of 500 leading companies in leading industries of the U.S. economy. NYSE Group, Inc. (NYSE:NYX) operates two securities exchanges: the New York Stock Exchange (the “NYSE”) and NYSE Arca (formerly known as the Archipelago Exchange, or ArcaEx®, and the Pacific Exchange). NYSE Group is a leading provider of securities listing, trading and market data products and services. The New York Mercantile Exchange, Inc. (NYMEX) is the world’s largest physical commodity futures exchange and the preeminent trading forum for energy and precious metals, with trading conducted through two divisions – the NYMEX Division, home to the energy, platinum, and palladium markets, and the COMEX Division, on which all other metals trade. The MERVAL Index (MERcado de VALores, literally Stock Exchange) is the most important index of the Buenos Aires Stock Exchange. The IBEX 35 is the benchmark stock market index of the Bolsa de Madrid, Spain’s principal stock exchange. BSE Sensex or Bombay Stock Exchange Sensitivity Index is a value-weighted index composed of 30 stocks that started January 1, 1986. The MSCI Emerging Markets Index is a float-adjusted market capitalization index consisting of indices in more than 25 emerging economies. The Straits Times Index (STI), maintained & calculated by FTSE, is the most globally-recognised benchmark index and market barometer for Singapore. The Bovespa Index is an index of about 50 stocks that are traded on the São Paulo Stock, Mercantile & Futures Exchange. The DAX 30 is a Blue Chip stock market index consisting of the 30 major German companies trading on the Frankfurt Stock Exchange. The FTSE MIB (Milano Italia Borsa) is the benchmark stock market index for the Borsa Italiana, the Italian national stock exchange. The EURO STOXX 50 Index, Europe’s leading Blue-chip index for the Eurozone, provides a Blue-chip representation of supersector leaders in the Eurozone. The Global Dow (GDOW) is a 150-stock index of corporations from around the world, created by Dow Jones & Company. Only blue-chip stocks are included in the index. The Hang Seng Index is a free float-adjusted market capitalization-weighted stock market index that is the main indicator of the overall market performance in Hong Kong. The Korea Composite Stock Price Index or KOSPI is the major stock market index of South Korea, representing all common stocks traded on the Korea Exchange. The RTS Index “Russia Trading System is a free-float capitalization-weighted index of 50 Russian stocks traded on the Moscow Exchange in Moscow, Russia. Nikkei 225 (Ticker: ^N225) is a stock market index for the Tokyo Stock Exchange (TSE). The Nikkei average is the most watched index of Asian stocks. The SSE Composite Index is an index of all stocks (A and B shares) that are traded at the Shanghai Stock Exchange. The FTSE 100 Index is a share index of the 100 most highly capitalized companies listed on the London Stock Exchange. The MSCI World Index is a free-float weighted equity index that includes developed world markets, and does not include emerging markets. The Russell 2000 Index is a small-cap stock market index of the bottom 2,000 stocks in the Russell 3000 Index. The CBOE Volatility Index® is a key measure of market expectations of near-term volatility conveyed by S&P 500 stock index option prices. The PHLX Housing Sector Index (HGX) is a modified market capitalization-weighted index composed of companies whose primary lines of business are directly associated with the U.S. housing construction market. The Nasdaq-100 Index includes 100 of the largest domestic and international non-financial companies listed on The Nasdaq Stock Market based on market capitalization. Additional risks are associated with international investing, such as currency fluctuations, political and economic instability and differences in accounting standards. This material represents an assessment of the market environment at a specific point in time and is not intended to be a forecast of future events, or a guarantee of future results. MarketingPro, Inc. is not affiliated with any person or firm that may be providing this information to you. The publisher is not engaged in rendering legal, accounting or other professional services. If assistance is needed, the reader is advised to engage the services of a competent professional.
Citations.
1 – marketwatch.com/story/markets-were-full-of-green-in-the-first-quarter-with-a-few-dashes-of-red-2017-03-31 [3/31/17]
2 – barchart.com/stocks/indices#/viewName=performance [3/31/17]
3 – investing.com/economic-calendar/ [3/31/17]
4 – tradingeconomics.com/united-states/consumer-confidence [4/2/17]
5 – instituteforsupplymanagement.org/about/MediaRoom/newsreleasedetail.cfm?ItemNumber=30697 [4/3/17]
6 – instituteforsupplymanagement.org/ISMReport/NonMfgROB.cfm [3/3/17]
7 – arkansasonline.com/news/2017/apr/01/u-s-consumer-spending-up-0-1-20170401/ [4/1/17]
8 – equities.com/news/a-strong-jobs-report-and-a-growing-divergence-between-jobs-and-employment [3/10/17]
9 – marketwatch.com/story/fed-raises-interest-rates-by-a-quarter-point-sees-two-move-moves-this-year-2017-03-15 [3/15/17]
10 – thehill.com/policy/finance/325703-week-ahead-gop-digs-into-dodd-frank-reform-senate-panel-to-vote-on-trump-labor [3/27/17]
11 – usatoday.com/story/news/world/2017/03/29/britain-invokes-article-50-4-things-know-brexit/99769996/ [3/29/17]
12 – ec.europa.eu/eurostat/ [4/3/17]
13 – seattletimes.com/business/asia-economies-hold-trade-pact-talks-after-trump-dumps-tpp/ [2/26/17]
14 – reuters.com/article/us-global-economy-idUSKBN1750H4 [3/31/17]
15 – online.wsj.com/mdc/public/page/2_3022-intlstkidx.html [3/31/17]
16 – msci.com/end-of-day-data-search [3/31/17]
17 – seekingalpha.com/article/4059685-commodities-first-quarter-overview-outlook-q2 [4/3/17]
18 – money.cnn.com/data/commodities/ [3/31/17]
19 – freddiemac.com/pmms/pmms_archives.html [4/3/17]
20 – freddiemac.com/pmms/archive.html?year=2016 [12/29/16]
21 – inman.com/2017/03/22/existing-home-sales-backtrack-in-february-after-january-high/ [3/22/17]
22 – constructiondive.com/news/new-home-sales-hit-7-month-high-in-february/438768/ [3/23/17]
23 – http://barchart.com/stocks/indices#/viewName=performance [12/30/16]
24 – bigcharts.marketwatch.com/historical/default.asp?symb=DJIA&closeDate=3%2F31%2F16&x=0&y=0 [3/31/17]
24 – bigcharts.marketwatch.com/historical/default.asp?symb=COMP&closeDate=3%2F31%2F16&x=0&y=0 [3/31/17]
24 – bigcharts.marketwatch.com/historical/default.asp?symb=SPX&closeDate=3%2F31%2F16&x=0&y=0 [3/31/17]
24 – bigcharts.marketwatch.com/historical/default.asp?symb=DJIA&closeDate=3%2F30%2F07&x=0&y=0 [3/31/17]
24 – bigcharts.marketwatch.com/historical/default.asp?symb=COMP&closeDate=3%2F30%2F07&x=0&y=0 [3/31/17]
24 – bigcharts.marketwatch.com/historical/default.asp?symb=SPX&closeDate=3%2F30%2F07&x=0&y=0 [3/31/17]
25 – treasury.gov/resource-center/data-chart-center/interest-rates/Pages/TextView.aspx?data=realyieldAll [4/3/17]
26 – fortune.com/2017/03/09/stock-market-bull-market-longest/ [3/9/17]
Other Information:
Adams Wealth Management Group LLC (“Adams Wealth Management”) is a registered investment adviser offering advisory services in the State of Texas and in other jurisdictions where exempted. Registration does not imply a certain level of skill or training. The presence of this website on the Internet shall not be directly or indirectly interpreted as a solicitation of investment advisory services to persons of another jurisdiction unless otherwise permitted by statute. Follow-up or individualized responses to consumers in a particular state by Adams Wealth Management in the rendering of personalized investment advice for compensation shall not be made without our first complying with jurisdiction requirements or pursuant an applicable state exemption.
All written content on this site is for information purposes only. Opinions expressed herein are solely those of Adams Wealth Management, unless otherwise specifically cited. Material presented is believed to be from reliable sources and no representations are made by our firm as to another parties’ informational accuracy or completeness. All information or ideas provided should be discussed in detail with an advisor, accountant or legal counsel prior to implementation.
All investing involves risk, including the potential for loss of principal. There is no guarantee that any investment strategy or plan will be successful.
THE QUARTER IN BRIEF
The opening quarter of 2017 was a historic one for Wall Street as the Dow Jones Industrial Average topped 20,000 for the first time. Equities rallied through January and February, then lost momentum in March; even so, the S&P 500 had gained 5.53% YTD when the quarter ended. The Federal Reserve raised the federal funds rate for only the third time in a decade, in response to strengthening inflation pressure and other signals of economic acceleration. Consumer confidence remained high. Commodities had a decidedly mixed quarter. New home sales improved, while existing home sales tapered off. The U.K. took another step toward its Brexit; the U.S. left the Trans-Pacific Partnership. Wall Street kept its hopes up for tax reform and lighter business and banking industry regulation.(1,2)
DOMESTIC ECONOMIC HEALTH
As the stock market climbed, so did the Conference Board’s consumer confidence index. By March, it had reached an astonishingly high mark of 125.6. The University of Michigan’s household sentiment index declined from 98.5 to 96.9 across the quarter, but it remained well above its historical average of 86.0.(3,4)
Factory and service sectors expanded nicely during Q1, according to the Institute for Supply Management. The Arizona-based organization’s manufacturing purchasing manager index was at 56.0 in January, 57.7 in February, and 57.2 in March. Its service sector PMI (the March number was not available at this writing) came in at 56.5 in January and 57.6 in February. All these numbers indicate solid growth.(5,6)
One other sign of economic growth, of course, is inflation. In Q1, it became more palpable. By February, the Consumer Price Index had risen 2.7% in a year (the annualized advance on the core CPI was 2.2%). Producer prices were up as well. The headline PPI showed a 2.2% yearly advance in February, with core prices gaining 1.5% over 12 months.(3)
Currently available data shows tepid consumer spending at the beginning of 2017. Personal spending was up just 0.2% in the opening month of the year and only 0.1% in February. Consumer incomes, however, rose 0.5% in January, then 0.4% in February. Households sent headline retail sales 0.6% higher in January, but only 0.1% a month later. There were gains in durable goods orders in both January (2.3%) and February (1.7%).(3,7)
January’s Department of Labor jobs report showed the headline jobless rate at 4.8% and the U-6 rate measuring underemployment at 9.4%; a month later, those unemployment rates were respectively lower at 4.7% and 9.2%. Hiring was strong in both January and February, with 238,000 net new jobs added to payrolls in the first month and 235,000 net new jobs added in the second.(8)
All this data encouraged the Federal Reserve to make its first interest rate move of the year. On March 15, it announced a widely expected, quarter-point hike, taking the federal funds rate to a target range of 0.75-1.00%. As Fed chair Janet Yellen told the media after the policy announcement, “The simple message is, the economy is doing well.” Investors who assumed the hike was coming scrutinized the Fed’s dot-plot forecast for any 2017 changes; they did not find any. Two incremental rate increases are still projected before the year ends.(9)
Elsewhere in Washington, President Donald Trump signed an executive order commissioning a review of the Dodd-Frank Act. As Q1 ended, hearings on portions of Dodd-Frank were set to start in early April, with a chance of reform legislation being introduced in Congress during Q2.(10)
GLOBAL ECONOMIC HEALTH
In late March, the United Kingdom formally triggered Article 50 of the Lisbon Treaty – the beginning of the Brexit, if you will. It now has until April 2019 to negotiate the terms of its departure from the European Union. Will it retain single market access after the Brexit, so that its citizens can keep working and living in other E.U. countries without visas? Or will it make a “hard” Brexit, a divorce dictated by court decisions and/or World Trade Organization rules that would cause its people to lose E.U. citizenship rights? In April, the negotiations begin. The euro area jobless rate stood at 9.5% as of February, a low unseen since May 2009. Eurostat estimated an inflation rate of 1.5% for the euro area for March, an 0.5% decline from February.(11,12)
As the United States left the Trans-Pacific Partnership during the quarter, Asia-Pacific nations seeking a regional trade pact turned to Plan B – Plan B being the Regional Comprehensive Economic Partnership. This free trade agreement, now in negotiation, would bring China, Japan, and India into an economic accord with 13 other Asia-Pacific neighbors, including some of the region’s poorest nations, such as Myanmar and Laos. Asia-Pacific manufacturing purchasing manager indices improved as Q1 ended, with China’s official PMI advancing 0.2 points to 51.8 in March for its best reading since April 2012. Japanese and Indian factory activity also accelerated in March, with India’s PMI hitting a 5-month high.(13,14)
WORLD MARKETS
As of March 31, the five best YTD performers among consequential global stock indices were Argentina’s MERVAL at +19.8%, Spain’s IBEX 35 at +11.9%, India’s Sensex at +11.2%, the MSCI Emerging Markets at +11.1%, and Singapore’s Straits Times at +10.2%. There were other big quarterly gains: 7.9% for Brazil’s Bovespa, 7.2% for Germany’s DAX, 6.5% for Italy’s FTSE MIB, 6.4% for the Euro Stoxx 50, 6.3% for the Global Dow, 9.6% for Hong Kong’s Hang Seng, and 6.6% for South Korea’s Kospi.(15,16)
In fact, it is hard to find a marquee stock index that retreated in Q1. Scrutiny reveals two: Russia’s RTS slipped 3.3%, and Japan’s Nikkei 225 lost 1.1%. To round things out, China’s Shanghai Composite gained 3.8% in Q1; the United Kingdom’s FTSE 100, 2.5%; and the MSCI World, 5.9%.(15,16)
COMMODITIES MARKETS
For metals investors, the first quarter brought much to cheer about. Investors in soft commodities had less to celebrate.
Palladium had a great Q1, rising 17.46%; aluminum was not far behind at 14.87%. COMEX silver ended the quarter at $18.28, gaining 14.50%. COMEX gold futures advanced 8.64% to settle at $1,247.40. Lastly, copper gained 5.84%, and platinum, 5.21%. Cotton led the way in ag futures with a 9.46% Q1 improvement; rice was next with a gain of 5.77%. CBOT wheat futures rose 4.53%, while corn futures added 3.48%.(17,18)
The quarter also saw some double-digit drops. Orange juice futures stumbled 20.75%; natural gas, 14.85%; and sugar, 14.10%. Other setbacks occurred for heating oil (8.89%), soybean oil (7.67%), WTI crude (5.81%), soybeans (5.07%), tin (4.56%), oats (1.86%), cocoa (1.46%), and nickel (1.39%). Oil finished the quarter at a NYMEX price of $50.85.(17,18)
REAL ESTATE
Q: Did mortgage rates ascend or descend in the first quarter? A: They descended. On December 29, the average interest rate on a conventional home loan was 4.32%, according to Freddie Mac’s Primary Mortgage Market Survey. By the March 30 PMMS, it was just 4.14%. Similar declines were seen for the average rate on the refinancer’s favorite, the 15-year FRM (3.55% to 3.39%), and the average rate on the 5/1-year ARM (3.30% to 3.18%).(19,20)
Census Bureau data showed new home sales rising 5.3% in January and another 6.1% in February. Resales wavered, increasing 3.3% for January and decreasing 3.7% the next month, according to the National Association of Realtors.(3)
Regarding the sales numbers that matter most (the annualized ones), existing home sales were up 5.4% in the year ending in February; new home sales, 12.8%. In the second month of 2017, the median price for an existing home was up 7.7% from a year ago at $228,400. The median new home price was up at $329,900 as of December, but it had fallen to $296,200 by February.(21,22)
What did other key real estate indicators do in the quarter? Housing starts and building permits went in opposite directions. Starts fell 1.9% in January, then rose 3.0% a month later; permits advanced 4.6% for January, but retreated 6.2% in February. NAR’s pending home sales index rose 5.5% to 112.3 in February after slipping 2.8% in January. Finally, January’s 20-city S&P/Case-Shiller home price index arrived in late March, revealing an 0.2% monthly improvement and a 5.7% annualized advance.
(3)
LOOKING BACK…LOOKING FORWARD
On March 31, the key U.S. equity indices settled at these levels: Dow, 20,663.22; Nasdaq, 5,911.74; S&P 500, 2,362.72; Russell 2000, 1,385.92. The Russell did not quite gain as much as the big three in Q1 – it was up 2.12% YTD when March concluded. The CBOE VIX? It finished Q1 down 11.89% YTD – in fact, it was the worst performer among significant indices. The PHLX Housing Index was the quarter’s best performer, gaining 11.96%; the Nasdaq 100 was a close second, advancing 11.77%.(2)
Some truly remarkable things happened in Q1. The Dow closed at a record high for 12 straight trading days – a feat that last occurred in 1987. The blue chips also went on an 8-session losing streak for the first time since 2011. As the table below shows, the Nasdaq gained more in three months than it did during all of 2016.(1)
Indices are unmanaged, do not incur fees or expenses, and cannot be invested into directly. These returns do not include dividends. 10-year TIPS real yield = projected return at maturity given expected inflation.
This material was prepared by MarketingPro, Inc., and does not necessarily represent the views of the presenting party, nor their affiliates. The information herein has been derived from sources believed to be accurate. Please note – investing involves risk, and past performance is no guarantee of future results. Investments will fluctuate and when redeemed may be worth more or less than when originally invested. This information should not be construed as investment, tax or legal advice and may not be relied on for the purpose of avoiding any Federal tax penalty. This is neither a solicitation nor recommendation to purchase or sell any investment or insurance product or service, and should not be relied upon as such. Indices do not incur management fees, costs and expenses, and cannot be invested into directly. All economic and performance data is historical and not indicative of future results. The Dow Jones Industrial Average is a price-weighted index of 30 actively traded blue-chip stocks. The NASDAQ Composite Index is a market-weighted index of all over-the-counter common stocks traded on the National Association of Securities Dealers Automated Quotation System. The Standard & Poor’s 500 (S&P 500) is a market-cap weighted index composed of the common stocks of 500 leading companies in leading industries of the U.S. economy. NYSE Group, Inc. (NYSE:NYX) operates two securities exchanges: the New York Stock Exchange (the “NYSE”) and NYSE Arca (formerly known as the Archipelago Exchange, or ArcaEx®, and the Pacific Exchange). NYSE Group is a leading provider of securities listing, trading and market data products and services. The New York Mercantile Exchange, Inc. (NYMEX) is the world’s largest physical commodity futures exchange and the preeminent trading forum for energy and precious metals, with trading conducted through two divisions – the NYMEX Division, home to the energy, platinum, and palladium markets, and the COMEX Division, on which all other metals trade. The MERVAL Index (MERcado de VALores, literally Stock Exchange) is the most important index of the Buenos Aires Stock Exchange. The IBEX 35 is the benchmark stock market index of the Bolsa de Madrid, Spain’s principal stock exchange. BSE Sensex or Bombay Stock Exchange Sensitivity Index is a value-weighted index composed of 30 stocks that started January 1, 1986. The MSCI Emerging Markets Index is a float-adjusted market capitalization index consisting of indices in more than 25 emerging economies. The Straits Times Index (STI), maintained & calculated by FTSE, is the most globally-recognised benchmark index and market barometer for Singapore. The Bovespa Index is an index of about 50 stocks that are traded on the São Paulo Stock, Mercantile & Futures Exchange. The DAX 30 is a Blue Chip stock market index consisting of the 30 major German companies trading on the Frankfurt Stock Exchange. The FTSE MIB (Milano Italia Borsa) is the benchmark stock market index for the Borsa Italiana, the Italian national stock exchange. The EURO STOXX 50 Index, Europe’s leading Blue-chip index for the Eurozone, provides a Blue-chip representation of supersector leaders in the Eurozone. The Global Dow (GDOW) is a 150-stock index of corporations from around the world, created by Dow Jones & Company. Only blue-chip stocks are included in the index. The Hang Seng Index is a free float-adjusted market capitalization-weighted stock market index that is the main indicator of the overall market performance in Hong Kong. The Korea Composite Stock Price Index or KOSPI is the major stock market index of South Korea, representing all common stocks traded on the Korea Exchange. The RTS Index “Russia Trading System is a free-float capitalization-weighted index of 50 Russian stocks traded on the Moscow Exchange in Moscow, Russia. Nikkei 225 (Ticker: ^N225) is a stock market index for the Tokyo Stock Exchange (TSE). The Nikkei average is the most watched index of Asian stocks. The SSE Composite Index is an index of all stocks (A and B shares) that are traded at the Shanghai Stock Exchange. The FTSE 100 Index is a share index of the 100 most highly capitalized companies listed on the London Stock Exchange. The MSCI World Index is a free-float weighted equity index that includes developed world markets, and does not include emerging markets. The Russell 2000 Index is a small-cap stock market index of the bottom 2,000 stocks in the Russell 3000 Index. The CBOE Volatility Index® is a key measure of market expectations of near-term volatility conveyed by S&P 500 stock index option prices. The PHLX Housing Sector Index (HGX) is a modified market capitalization-weighted index composed of companies whose primary lines of business are directly associated with the U.S. housing construction market. The Nasdaq-100 Index includes 100 of the largest domestic and international non-financial companies listed on The Nasdaq Stock Market based on market capitalization. Additional risks are associated with international investing, such as currency fluctuations, political and economic instability and differences in accounting standards. This material represents an assessment of the market environment at a specific point in time and is not intended to be a forecast of future events, or a guarantee of future results. MarketingPro, Inc. is not affiliated with any person or firm that may be providing this information to you. The publisher is not engaged in rendering legal, accounting or other professional services. If assistance is needed, the reader is advised to engage the services of a competent professional.
Citations.
1 – marketwatch.com/story/markets-were-full-of-green-in-the-first-quarter-with-a-few-dashes-of-red-2017-03-31 [3/31/17]
2 – barchart.com/stocks/indices#/viewName=performance [3/31/17]
3 – investing.com/economic-calendar/ [3/31/17]
4 – tradingeconomics.com/united-states/consumer-confidence [4/2/17]
5 – instituteforsupplymanagement.org/about/MediaRoom/newsreleasedetail.cfm?ItemNumber=30697 [4/3/17]
6 – instituteforsupplymanagement.org/ISMReport/NonMfgROB.cfm [3/3/17]
7 – arkansasonline.com/news/2017/apr/01/u-s-consumer-spending-up-0-1-20170401/ [4/1/17]
8 – equities.com/news/a-strong-jobs-report-and-a-growing-divergence-between-jobs-and-employment [3/10/17]
9 – marketwatch.com/story/fed-raises-interest-rates-by-a-quarter-point-sees-two-move-moves-this-year-2017-03-15 [3/15/17]
10 – thehill.com/policy/finance/325703-week-ahead-gop-digs-into-dodd-frank-reform-senate-panel-to-vote-on-trump-labor [3/27/17]
11 – usatoday.com/story/news/world/2017/03/29/britain-invokes-article-50-4-things-know-brexit/99769996/ [3/29/17]
12 – ec.europa.eu/eurostat/ [4/3/17]
13 – seattletimes.com/business/asia-economies-hold-trade-pact-talks-after-trump-dumps-tpp/ [2/26/17]
14 – reuters.com/article/us-global-economy-idUSKBN1750H4 [3/31/17]
15 – online.wsj.com/mdc/public/page/2_3022-intlstkidx.html [3/31/17]
16 – msci.com/end-of-day-data-search [3/31/17]
17 – seekingalpha.com/article/4059685-commodities-first-quarter-overview-outlook-q2 [4/3/17]
18 – money.cnn.com/data/commodities/ [3/31/17]
19 – freddiemac.com/pmms/pmms_archives.html [4/3/17]
20 – freddiemac.com/pmms/archive.html?year=2016 [12/29/16]
21 – inman.com/2017/03/22/existing-home-sales-backtrack-in-february-after-january-high/ [3/22/17]
22 – constructiondive.com/news/new-home-sales-hit-7-month-high-in-february/438768/ [3/23/17]
23 – barchart.com/stocks/indices.php?view=performance [12/30/16]
24 – bigcharts.marketwatch.com/historical/default.asp?symb=DJIA&closeDate=3%2F31%2F16&x=0&y=0 [3/31/17]
24 – bigcharts.marketwatch.com/historical/default.asp?symb=COMP&closeDate=3%2F31%2F16&x=0&y=0 [3/31/17]
24 – bigcharts.marketwatch.com/historical/default.asp?symb=SPX&closeDate=3%2F31%2F16&x=0&y=0 [3/31/17]
24 – bigcharts.marketwatch.com/historical/default.asp?symb=DJIA&closeDate=3%2F30%2F07&x=0&y=0 [3/31/17]
24 – bigcharts.marketwatch.com/historical/default.asp?symb=COMP&closeDate=3%2F30%2F07&x=0&y=0 [3/31/17]
24 – bigcharts.marketwatch.com/historical/default.asp?symb=SPX&closeDate=3%2F30%2F07&x=0&y=0 [3/31/17]
25 – treasury.gov/resource-center/data-chart-center/interest-rates/Pages/TextView.aspx?data=realyieldAll [4/3/17]
26 – fortune.com/2017/03/09/stock-market-bull-market-longest/ [3/9/17]
Other Information:
Adams Wealth Management Group LLC (“Adams Wealth Management”) is a registered investment adviser offering advisory services in the State of Texas and in other jurisdictions where exempted. Registration does not imply a certain level of skill or training. The presence of this website on the Internet shall not be directly or indirectly interpreted as a solicitation of investment advisory services to persons of another jurisdiction unless otherwise permitted by statute. Follow-up or individualized responses to consumers in a particular state by Adams Wealth Management in the rendering of personalized investment advice for compensation shall not be made without our first complying with jurisdiction requirements or pursuant an applicable state exemption.
All written content on this site is for information purposes only. Opinions expressed herein are solely those of Adams Wealth Management, unless otherwise specifically cited. Material presented is believed to be from reliable sources and no representations are made by our firm as to another parties’ informational accuracy or completeness. All information or ideas provided should be discussed in detail with an advisor, accountant or legal counsel prior to implementation.
All investing involves risk, including the potential for loss of principal. There is no guarantee that any investment strategy or plan will be successful.
