
MONTHLY QUOTE
“Doubt is not a pleasant condition, but certainty is absurd.”
– Voltaire
MONTHLY TIP
A warning: crooks often try to trick retirees into giving up their personal information with offers of deeply discounted or free medical services. If you receive such an offer, contact the Better Business Bureau to see if the company can be trusted.
MONTHLY RIDDLE
Poke your fingers in my eyes and I will open wide my jaws. Linen, hair, or paper, I can reduce it all. What am I?
Last month’s riddle
It can fit down a chimney when it is down. It has a hard time going down a chimney when it is up. You can hold it with one hand, and make it expand. What is it?
Last week’s answer:
An umbrella.
THE MONTH IN BRIEF
May was another good month for stocks. The S&P 500 gained more than 1%, putting its YTD advance above 7.7%. While the housing market showed some spring weakness, hiring bounced back and most other important economic indicators did not falter. Wall Street seemed little troubled by politics, terrorist incidents, data disappointments, or earnings misses. Overseas, stock benchmarks largely advanced, some impressively. Gasoline futures ascended; mortgage rates descended. Both investors and consumers seemed firmly confident.(1)
DOMESTIC ECONOMIC HEALTH
The Department of Labor’s latest employment report showed a rebound in job creation. While March saw just 79,000 net new jobs, that number increased to 211,000 in April. These additions left the main (U-3) jobless rate at 4.4%, a 10-year low. The U-6 rate, including the underemployed, fell 0.3% to 8.6%, another low unseen for nearly a decade. Numbers like these seemed to amount to a green light for a June interest rate hike at the Federal Reserve.(2)
Later in the month, however, word arrived that the Fed was more cautious about a June hike than some investors assumed. May ended with the Bureau of Economic Analysis revising the Q1 GDP number north by half a percent to 1.2%, but that was still far from impressive. Minutes from the May 2-3 Federal Open Market Committee meeting noted that FOMC members “generally judged that it would be prudent to await additional evidence” of the economy picking up before making another policy move. Still, the Fed futures market had the chance of a June rate increase at 83% in late May.(3,4)
Consumers were still very confident, according to the two most-watched household sentiment indices; though, those gauges did not go higher in May. The University of Michigan’s index posted an initial May reading of 97.7 and a final May reading of 97.1, leaving it just 0.1 points above its final April mark. Falling 1.5 points, the Conference Board’s index ended the month at 117.9.(3)
As far as goods and services, the news was generally good. Retail sales advanced 0.4% in April; core retail sales, 0.3%. The fourth month of 2017 saw gains of 0.4% for both personal spending and personal incomes. Hard goods orders were down 0.7% in April, 0.8% minus defense orders.(3)
The Institute for Supply Management’s purchasing manager index measuring factory growth ticked up 0.1 points to a solid 54.9 in May. Early in May, ISM’s service sector PMI showed an impressive April reading of 57.5, up 2.3 points from March; that was its second-best reading in the past 12 months.(5,6)
Yearly core consumer inflation dipped under 2% in April. The 1.9% annualized reading on the core Consumer Price Index followed a mere 0.1% April advance for that indicator. Headline consumer inflation was up 0.2% in April, leaving the year-over-year advance for the main CPI at 2.2%. The Producer Price Index rose 0.5% in April, resulting in 2.5% annualized wholesale inflation.(3)
GLOBAL ECONOMIC HEALTH
The economy of the euro area is clearly in better shape than it has been in some time. Unemployment fell to 9.3% in April, which was an 8-year low and nearly a percentage point lower than in April 2016. A 0.4% spike in consumer prices had left annualized inflation at 1.9% in April, as opposed to 0.2% deflation a year earlier; Eurostat, the statistical office of the European Commission, projected inflation moderating to 1.4% in May. The IHS Markit manufacturing PMI for the eurozone was at 56.8 in May, representing a six-year high; Germany’s factory PMI was even higher at 59.4.(7,8)
As for Chinese manufacturing, the latest news was good. The nation’s official factory and service sector PMIs respectively came in at 51.2 and 54.5 for May; the factory PMI was unchanged from April, while the services PMI rose. These good, if not spectacular, numbers backed up the broad assumptions of economists inside and outside China: the 6.9% growth seen in the year’s first quarter was a nice anomaly. China is officially forecasting 6.5% economic expansion for 2017. Fresh data showed that Japan’s economy grew at the fastest pace in a year in Q1.(9,10)
WORLD MARKETS
Bulls sent many important benchmarks higher in May. In Europe, the FTSE 100 jumped 4.39% for the month; smaller gains were notched by the IBEX 35 (1.53%), DAX (1.42%), FTSE Eurofirst 300 (0.84%), and CAC-40 (0.31%). Russia’s MICEX took a big loss, sliding 5.77%.(11)
Away from Europe, South Korea’s Kospi had a banner month, surging 6.44%. Argentina’s MERVAL rose nearly that much, advancing 6.14%. Major gains were also made by Hong Kong’s Hang Seng (4.25%) as well as India’s Sensex (4.10%) and Nifty 50 (3.41%). MSCI’s Emerging Markets index added 2.80%; Japan’s Nikkei 225, 2.36%; and Taiwan’s TSE 50, 2.08%. The MSCI World index improved 1.78%. May losses came for Mexico’s Bolsa (0.96%), the Shanghai Composite (1.18%), the TSX Composite (1.52%), Brazil’s Bovespa (2.20%), and Australia’s All Ordinaries (3.13%).(11,12)
COMMODITIES MARKETS
Cocoa futures pulled off the biggest gain among major commodities, rising 10.74% during May. The rest of the ag sector was mixed, with corn rising 2.52%, soybeans down 3.42%, wheat gaining 2.93%, coffee adding 1.78%, cotton surging 6.94%, and sugar sinking 6.36%. On the COMEX, gold closed on May 31 at $1,268.00 after a mere 0.06% May advance. Silver futures rose 1.02% in May to reach $17.32 as the month ended. Platinum futures lost 0.57% for May; copper futures, 0.41%. The U.S. Dollar Index fell 2.08% across the month to 96.98 on May 31.(13,14)
Crude lost 0.81% for the month on its way to a May 31 NYMEX close of $48.82. Heating oil added 1.78% in May, while natural gas gave back 5.60%. Gasoline futures staged a notable rally, rising 4.59% last month.(13)
REAL ESTATE
Home sales had to cool off at some point in 2017. According to reports from the National Association of Realtors and Census Bureau, the housing market reached that point in April. The NAR reported a 2.3% slip for resales, while the Bureau noted new home sales sliding by 11.4%. April also saw housing starts decline by 2.6%, with permits for future construction down by 2.5%. Pending home sales, tracked by the NAR, declined 1.3% in April.(3)
The latest 20-city composite S&P/Case-Shiller home price index showed home prices rising 1.0% for March, keeping the yearly gain of the index at 5.9%. The broader national Case-Shiller index was up 5.8% annually through March, its best showing in 33 months.(3,15)
As for home loans, Freddie Mac’s May 25 Primary Mortgage Market Survey reported average interest rates on mortgage types as follows: 30-year FRM, 3.95%; 15-year FRM, 3.19%; 5/1-year ARM, 3.07%. On April 27, all three mortgage classes were more expensive, bearing the following interest rates: 30-year FRM, 4.03%; 15-year FRM, 3.27%; 5/1-year ARM, 3.12%.(16)
LOOKING BACK…LOOKING FORWARD
During May, the Nasdaq Composite set the pace for the consequential U.S. equity indices. The tech-heavy benchmark rose 2.50% to end the month at 6,198.52. The Dow Industrials improved 0.33% across the month to settle at 21,008.65 on May 31, while the S&P 500 advanced 1.16% to a month-end close of 2,411.80. Small caps stumbled in May – the Russell 2000 fell 2.16% to 1,370.21, leaving it at just +0.96% YTD. The CBOE VIX lost 2.77% to end May at a very low 10.41, and that put the “fear index” down 25.07% on the year.(1)
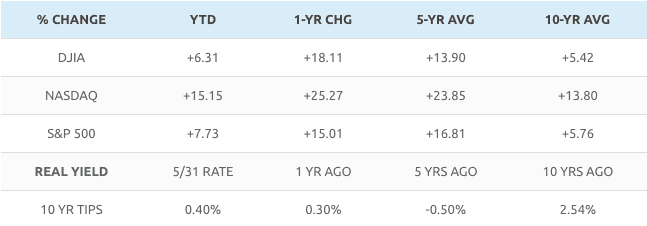
Sources: barchart.com, bigcharts.com, treasury.gov – 5/31/17(1,17,18,19)
Indices are unmanaged, do not incur fees or expenses, and cannot be invested into directly. These returns do not include dividends. 10-year TIPS real yield = projected return at maturity given expected inflation.
The year is certainly going well on Wall Street. All three major indices are on pace for double-digit yearly returns; the Nasdaq Composite just advanced for a seventh straight month, a streak unequaled since 2013. Investors widely expect the Fed to hike this month, so a quarter-point rate move will not serve as any kind of market shock; the goings-on in Washington have not distracted the bulls from buying, either. Perhaps, the calm we have seen on the Street, so far, this spring can last for another month and encourage further gains.(20)
UPCOMING ECONOMIC RELEASES: Across the balance of June, here are the key data releases to watch: The ISM services PMI and April factory orders (6/5), the May PPI (6/13), an FOMC rate decision, May retail sales, and the May CPI (6/14), May industrial production (6/15), May groundbreaking and building permits and June’s initial University of Michigan consumer sentiment index (6/16), May existing home sales (6/21), May new home sales (6/23), May hard goods orders (6/26), the June Conference Board consumer confidence index (6/27), May pending home sales (6/28), the last estimate of Q1 growth from the federal government (6/29), and, then, the final June University of Michigan consumer sentiment index, the May PCE price index, and the May personal spending report (6/30).
For more news from Adams Wealth Management, click here.
This material was prepared by MarketingPro, Inc., and does not necessarily represent the views of the presenting party, nor their affiliates. The information herein has been derived from sources believed to be accurate. Please note – investing involves risk, and past performance is no guarantee of future results. Investments will fluctuate and when redeemed may be worth more or less than when originally invested. This information should not be construed as investment, tax or legal advice and may not be relied on for the purpose of avoiding any Federal tax penalty. This is neither a solicitation nor recommendation to purchase or sell any investment or insurance product or service, and should not be relied upon as such. All market indices discussed are unmanaged and are not illustrative of any particular investment. Indices do not incur management fees, costs and expenses, and cannot be invested into directly. All economic and performance data is historical and not indicative of future results. The Dow Jones Industrial Average is a price-weighted index of 30 actively traded blue-chip stocks. The NASDAQ Composite Index is a market-weighted index of all over-the-counter common stocks traded on the National Association of Securities Dealers Automated Quotation System. The Standard & Poor’s 500 (S&P 500) is a market-cap weighted index composed of the common stocks of 500 leading companies in leading industries of the U.S. economy. The Russell 2000 Index measures the performance of the small-cap segment of the U.S. equity universe. The CBOE Volatility Index® (VIX®) is a key measure of market expectations of near-term volatility conveyed by S&P 500 stock index option prices. NYSE Group, Inc. (NYSE:NYX) operates two securities exchanges: the New York Stock Exchange (the “NYSE”) and NYSE Arca (formerly known as the Archipelago Exchange, or ArcaEx®, and the Pacific Exchange). NYSE Group is a leading provider of securities listing, trading and market data products and services. The New York Mercantile Exchange, Inc. (NYMEX) is the world’s largest physical commodity futures exchange and the preeminent trading forum for energy and precious metals, with trading conducted through two divisions – the NYMEX Division, home to the energy, platinum, and palladium markets, and the COMEX Division, on which all other metals trade. . The FTSE 100 Index is a share index of the 100 companies listed on the London Stock Exchange with the highest market capitalization. The IBEX 35 is the benchmark stock market index of the Bolsa de Madrid, Spain’s principal stock exchange. The DAX 30 is a Blue Chip stock market index consisting of the 30 major German companies trading on the Frankfurt Stock Exchange. The FTSE Eurofirst 300 measures the performance of Europe’s largest 300 companies by market capitalization and covers 70% of Europe’s market cap. The CAC-40 Index is a narrow-based, modified capitalization-weighted index of 40 companies listed on the Paris Bourse. The MICEX 10 Index (Russian: Индекс ММВБ10) is an unweighted price index that tracks the ten most liquid Russian stocks listed on MICEX-RTS in Moscow. The Korea Composite Stock Price Index or KOSPI is the major stock market index of South Korea, representing all common stocks traded on the Korea Exchange. The MERVAL Index (MERcado de VALores, literally Stock Exchange) is the most important index of the Buenos Aires Stock Exchange. The Hang Seng Index is a free float-adjusted market capitalization-weighted stock market index that is the main indicator of the overall market performance in Hong Kong. The BSE SENSEX (Bombay Stock Exchange Sensitive Index), also-called the BSE 30 (BOMBAY STOCK EXCHANGE) or simply the SENSEX, is a free-float market capitalization-weighted stock market index of 30 well-established and financially sound companies listed on the Bombay Stock Exchange (BSE). The NIFTY 50 is a diversified 50-stock index accounting for 12 sectors of the Indian economy. The MSCI Emerging Markets Index is a float-adjusted market capitalization index consisting of indices in more than 25 emerging economies. Nikkei 225 (Ticker: ^N225) is a stock market index for the Tokyo Stock Exchange (TSE). The Nikkei average is the most watched index of Asian stocks. The FTSE TWSE Taiwan 50 Index consists of the largest 50 companies by full market value, and is also the first narrow-based index published in Taiwan. The MSCI World Index is a free-float weighted equity index that includes developed world markets, and does not include emerging markets. The Mexican Stock Exchange, commonly known as Mexican Bolsa, Mexbol, or BMV, is the only stock exchange in Mexico. The SSE Composite Index is an index of all stocks (A shares and B shares) that are traded at the Shanghai Stock Exchange. The S&P/TSX Composite Index is an index of the stock (equity) prices of the largest companies on the Toronto Stock Exchange (TSX) as measured by market capitalization. The Bovespa Index is a gross total return index weighted by traded volume & is comprised of the most liquid stocks traded on the Sao Paulo Stock Exchange. The All Ordinaries (XAO) is considered a total market barometer for the Australian stock market and contains the 500 largest ASX-listed companies by way of market capitalization. The US Dollar Index measures the performance of the U.S. dollar against a basket of six currencies. Additional risks are associated with international investing, such as currency fluctuations, political and economic instability and differences in accounting standards. This material represents an assessment of the market environment at a specific point in time and is not intended to be a forecast of future events, or a guarantee of future results. MarketingPro, Inc. is not affiliated with any person or firm that may be providing this information to you. The publisher is not engaged in rendering legal, accounting or other professional services. If assistance is needed, the reader is advised to engage the services of a competent professional.
Citations.
1 – barchart.com/stocks/indices#/viewName=performance [5/31/17]
2 – cnbc.com/2017/05/05/nonfarm-payrolls-april-2017.html [5/5/17]
3 – investing.com/economic-calendar/ [5/31/17]
4 – nytimes.com/2017/05/24/business/economy/fed-interest-rates-minutes.html [5/24/17]
5 – cnbc.com/2017/06/01/may-ism-manufacturing-index.html [6/1/17]
6 – tradingeconomics.com/united-states/non-manufacturing-pmi [5/31/17]
7 – ec.europa.eu/eurostat [5/31/17]
8 – marketwatch.com/story/european-stocks-rise-as-eurozone-economic-activity-hovers-at-6-year-high-2017-05-23 [5/23/17]
9 – bloomberg.com/news/articles/2017-05-31/china-manufacturing-gauge-exceeds-estimates-as-growth-holds-up [5/31/17]
10 – in.reuters.com/article/asia-economy-gdp-idINL4N1IK1JC [5/18/17]
11 – markets.on.nytimes.com/research/markets/worldmarkets/worldmarkets.asp [5/31/17]
12 – msci.com/end-of-day-data-search [5/31/17]
13 – money.cnn.com/data/commodities/ [5/31/17]
14 – marketwatch.com/investing/index/dxy/historical [5/31/17]
15 – builderonline.com/money/affordability/home-prices-continue-rise-in-march_o [5/30/17]
16 – freddiemac.com/pmms/archive.html?year=2017 [5/31/17]
17 – bigcharts.marketwatch.com/historical/default.asp?symb=DJIA&closeDate=5%2F31%2F16&x=0&y=0 [5/31/17]
17 – bigcharts.marketwatch.com/historical/default.asp?symb=COMP&closeDate=5%2F31%2F16&x=0&y=0 [5/31/17]
17 – bigcharts.marketwatch.com/historical/default.asp?symb=SPX&closeDate=5%2F31%2F16&x=0&y=0 [5/31/17]
17 – bigcharts.marketwatch.com/historical/default.asp?symb=DJIA&closeDate=5%2F31%2F12&x=0&y=0 [5/31/17]
17 – bigcharts.marketwatch.com/historical/default.asp?symb=COMP&closeDate=5%2F31%2F12&x=0&y=0 [5/31/17]
17 – bigcharts.marketwatch.com/historical/default.asp?symb=SPX&closeDate=5%2F31%2F12&x=0&y=0 [5/31/17]
17 – bigcharts.marketwatch.com/historical/default.asp?symb=DJIA&closeDate=5%2F31%2F07&x=0&y=0 [5/31/17]
17 – bigcharts.marketwatch.com/historical/default.asp?symb=COMP&closeDate=5%2F31%2F07&x=0&y=0 [5/31/17]
17 – bigcharts.marketwatch.com/historical/default.asp?symb=SPX&closeDate=5%2F31%2F07&x=0&y=0 [5/31/17]
18 – treasury.gov/resource-center/data-chart-center/interest-rates/Pages/TextView.aspx?data=realyield [5/31/17]
19 – treasury.gov/resource-center/data-chart-center/interest-rates/Pages/TextView.aspx?data=realyieldAll [5/31/17]
20 – https://www.barrons.com/articles/battle-lines-dow-ends-may-higher-what-will-june-bring-1496267260 [5/31/17]
Other Information:
Adams Wealth Management Group LLC (“Adams Wealth Management”) is a registered investment adviser offering advisory services in the State of Texas and in other jurisdictions where exempted. Registration does not imply a certain level of skill or training. The presence of this website on the Internet shall not be directly or indirectly interpreted as a solicitation of investment advisory services to persons of another jurisdiction unless otherwise permitted by statute. Follow-up or individualized responses to consumers in a particular state by Adams Wealth Management in the rendering of personalized investment advice for compensation shall not be made without our first complying with jurisdiction requirements or pursuant an applicable state exemption.
All written content on this site is for information purposes only. Opinions expressed herein are solely those of Adams Wealth Management, unless otherwise specifically cited. Material presented is believed to be from reliable sources and no representations are made by our firm as to another parties’ informational accuracy or completeness. All information or ideas provided should be discussed in detail with an advisor, accountant or legal counsel prior to implementation.
All investing involves risk, including the potential for loss of principal. There is no guarantee that any investment strategy or plan will be successful.
THE MONTH IN BRIEF
May was another good month for stocks. The S&P 500 gained more than 1%, putting its YTD advance above 7.7%. While the housing market showed some spring weakness, hiring bounced back and most other important economic indicators did not falter. Wall Street seemed little troubled by politics, terrorist incidents, data disappointments, or earnings misses. Overseas, stock benchmarks largely advanced, some impressively. Gasoline futures ascended; mortgage rates descended. Both investors and consumers seemed firmly confident.(1)
DOMESTIC ECONOMIC HEALTH
The Department of Labor’s latest employment report showed a rebound in job creation. While March saw just 79,000 net new jobs, that number increased to 211,000 in April. These additions left the main (U-3) jobless rate at 4.4%, a 10-year low. The U-6 rate, including the underemployed, fell 0.3% to 8.6%, another low unseen for nearly a decade. Numbers like these seemed to amount to a green light for a June interest rate hike at the Federal Reserve.(2)
Later in the month, however, word arrived that the Fed was more cautious about a June hike than some investors assumed. May ended with the Bureau of Economic Analysis revising the Q1 GDP number north by half a percent to 1.2%, but that was still far from impressive. Minutes from the May 2-3 Federal Open Market Committee meeting noted that FOMC members “generally judged that it would be prudent to await additional evidence” of the economy picking up before making another policy move. Still, the Fed futures market had the chance of a June rate increase at 83% in late May.(3,4)
Consumers were still very confident, according to the two most-watched household sentiment indices; though, those gauges did not go higher in May. The University of Michigan’s index posted an initial May reading of 97.7 and a final May reading of 97.1, leaving it just 0.1 points above its final April mark. Falling 1.5 points, the Conference Board’s index ended the month at 117.9.(3)
As far as goods and services, the news was generally good. Retail sales advanced 0.4% in April; core retail sales, 0.3%. The fourth month of 2017 saw gains of 0.4% for both personal spending and personal incomes. Hard goods orders were down 0.7% in April, 0.8% minus defense orders.(3)
The Institute for Supply Management’s purchasing manager index measuring factory growth ticked up 0.1 points to a solid 54.9 in May. Early in May, ISM’s service sector PMI showed an impressive April reading of 57.5, up 2.3 points from March; that was its second-best reading in the past 12 months.(5,6)
Yearly core consumer inflation dipped under 2% in April. The 1.9% annualized reading on the core Consumer Price Index followed a mere 0.1% April advance for that indicator. Headline consumer inflation was up 0.2% in April, leaving the year-over-year advance for the main CPI at 2.2%. The Producer Price Index rose 0.5% in April, resulting in 2.5% annualized wholesale inflation.(3)
GLOBAL ECONOMIC HEALTH
The economy of the euro area is clearly in better shape than it has been in some time. Unemployment fell to 9.3% in April, which was an 8-year low and nearly a percentage point lower than in April 2016. A 0.4% spike in consumer prices had left annualized inflation at 1.9% in April, as opposed to 0.2% deflation a year earlier; Eurostat, the statistical office of the European Commission, projected inflation moderating to 1.4% in May. The IHS Markit manufacturing PMI for the eurozone was at 56.8 in May, representing a six-year high; Germany’s factory PMI was even higher at 59.4.(7,8)
As for Chinese manufacturing, the latest news was good. The nation’s official factory and service sector PMIs respectively came in at 51.2 and 54.5 for May; the factory PMI was unchanged from April, while the services PMI rose. These good, if not spectacular, numbers backed up the broad assumptions of economists inside and outside China: the 6.9% growth seen in the year’s first quarter was a nice anomaly. China is officially forecasting 6.5% economic expansion for 2017. Fresh data showed that Japan’s economy grew at the fastest pace in a year in Q1.(9,10)
WORLD MARKETS
Bulls sent many important benchmarks higher in May. In Europe, the FTSE 100 jumped 4.39% for the month; smaller gains were notched by the IBEX 35 (1.53%), DAX (1.42%), FTSE Eurofirst 300 (0.84%), and CAC-40 (0.31%). Russia’s MICEX took a big loss, sliding 5.77%.(11)
Away from Europe, South Korea’s Kospi had a banner month, surging 6.44%. Argentina’s MERVAL rose nearly that much, advancing 6.14%. Major gains were also made by Hong Kong’s Hang Seng (4.25%) as well as India’s Sensex (4.10%) and Nifty 50 (3.41%). MSCI’s Emerging Markets index added 2.80%; Japan’s Nikkei 225, 2.36%; and Taiwan’s TSE 50, 2.08%. The MSCI World index improved 1.78%. May losses came for Mexico’s Bolsa (0.96%), the Shanghai Composite (1.18%), the TSX Composite (1.52%), Brazil’s Bovespa (2.20%), and Australia’s All Ordinaries (3.13%).(11,12)
COMMODITIES MARKETS
Cocoa futures pulled off the biggest gain among major commodities, rising 10.74% during May. The rest of the ag sector was mixed, with corn rising 2.52%, soybeans down 3.42%, wheat gaining 2.93%, coffee adding 1.78%, cotton surging 6.94%, and sugar sinking 6.36%. On the COMEX, gold closed on May 31 at $1,268.00 after a mere 0.06% May advance. Silver futures rose 1.02% in May to reach $17.32 as the month ended. Platinum futures lost 0.57% for May; copper futures, 0.41%. The U.S. Dollar Index fell 2.08% across the month to 96.98 on May 31.(13,14)
Crude lost 0.81% for the month on its way to a May 31 NYMEX close of $48.82. Heating oil added 1.78% in May, while natural gas gave back 5.60%. Gasoline futures staged a notable rally, rising 4.59% last month.(13)
REAL ESTATE
Home sales had to cool off at some point in 2017. According to reports from the National Association of Realtors and Census Bureau, the housing market reached that point in April. The NAR reported a 2.3% slip for resales, while the Bureau noted new home sales sliding by 11.4%. April also saw housing starts decline by 2.6%, with permits for future construction down by 2.5%. Pending home sales, tracked by the NAR, declined 1.3% in April.(3)
The latest 20-city composite S&P/Case-Shiller home price index showed home prices rising 1.0% for March, keeping the yearly gain of the index at 5.9%. The broader national Case-Shiller index was up 5.8% annually through March, its best showing in 33 months.(3,15)
As for home loans, Freddie Mac’s May 25 Primary Mortgage Market Survey reported average interest rates on mortgage types as follows: 30-year FRM, 3.95%; 15-year FRM, 3.19%; 5/1-year ARM, 3.07%. On April 27, all three mortgage classes were more expensive, bearing the following interest rates: 30-year FRM, 4.03%; 15-year FRM, 3.27%; 5/1-year ARM, 3.12%.(16)
LOOKING BACK…LOOKING FORWARD
During May, the Nasdaq Composite set the pace for the consequential U.S. equity indices. The tech-heavy benchmark rose 2.50% to end the month at 6,198.52. The Dow Industrials improved 0.33% across the month to settle at 21,008.65 on May 31, while the S&P 500 advanced 1.16% to a month-end close of 2,411.80. Small caps stumbled in May – the Russell 2000 fell 2.16% to 1,370.21, leaving it at just +0.96% YTD. The CBOE VIX lost 2.77% to end May at a very low 10.41, and that put the “fear index” down 25.07% on the year.(1)
Sources: barchart.com, bigcharts.com, treasury.gov – 5/31/17(1,17,18,19)
Indices are unmanaged, do not incur fees or expenses, and cannot be invested into directly. These returns do not include dividends. 10-year TIPS real yield = projected return at maturity given expected inflation.
The year is certainly going well on Wall Street. All three major indices are on pace for double-digit yearly returns; the Nasdaq Composite just advanced for a seventh straight month, a streak unequaled since 2013. Investors widely expect the Fed to hike this month, so a quarter-point rate move will not serve as any kind of market shock; the goings-on in Washington have not distracted the bulls from buying, either. Perhaps, the calm we have seen on the Street, so far, this spring can last for another month and encourage further gains.(20)
UPCOMING ECONOMIC RELEASES: Across the balance of June, here are the key data releases to watch: The ISM services PMI and April factory orders (6/5), the May PPI (6/13), an FOMC rate decision, May retail sales, and the May CPI (6/14), May industrial production (6/15), May groundbreaking and building permits and June’s initial University of Michigan consumer sentiment index (6/16), May existing home sales (6/21), May new home sales (6/23), May hard goods orders (6/26), the June Conference Board consumer confidence index (6/27), May pending home sales (6/28), the last estimate of Q1 growth from the federal government (6/29), and, then, the final June University of Michigan consumer sentiment index, the May PCE price index, and the May personal spending report (6/30).
For more news from Adams Wealth Management, click here.
This material was prepared by MarketingPro, Inc., and does not necessarily represent the views of the presenting party, nor their affiliates. The information herein has been derived from sources believed to be accurate. Please note – investing involves risk, and past performance is no guarantee of future results. Investments will fluctuate and when redeemed may be worth more or less than when originally invested. This information should not be construed as investment, tax or legal advice and may not be relied on for the purpose of avoiding any Federal tax penalty. This is neither a solicitation nor recommendation to purchase or sell any investment or insurance product or service, and should not be relied upon as such. All market indices discussed are unmanaged and are not illustrative of any particular investment. Indices do not incur management fees, costs and expenses, and cannot be invested into directly. All economic and performance data is historical and not indicative of future results. The Dow Jones Industrial Average is a price-weighted index of 30 actively traded blue-chip stocks. The NASDAQ Composite Index is a market-weighted index of all over-the-counter common stocks traded on the National Association of Securities Dealers Automated Quotation System. The Standard & Poor’s 500 (S&P 500) is a market-cap weighted index composed of the common stocks of 500 leading companies in leading industries of the U.S. economy. The Russell 2000 Index measures the performance of the small-cap segment of the U.S. equity universe. The CBOE Volatility Index® (VIX®) is a key measure of market expectations of near-term volatility conveyed by S&P 500 stock index option prices. NYSE Group, Inc. (NYSE:NYX) operates two securities exchanges: the New York Stock Exchange (the “NYSE”) and NYSE Arca (formerly known as the Archipelago Exchange, or ArcaEx®, and the Pacific Exchange). NYSE Group is a leading provider of securities listing, trading and market data products and services. The New York Mercantile Exchange, Inc. (NYMEX) is the world’s largest physical commodity futures exchange and the preeminent trading forum for energy and precious metals, with trading conducted through two divisions – the NYMEX Division, home to the energy, platinum, and palladium markets, and the COMEX Division, on which all other metals trade. . The FTSE 100 Index is a share index of the 100 companies listed on the London Stock Exchange with the highest market capitalization. The IBEX 35 is the benchmark stock market index of the Bolsa de Madrid, Spain’s principal stock exchange. The DAX 30 is a Blue Chip stock market index consisting of the 30 major German companies trading on the Frankfurt Stock Exchange. The FTSE Eurofirst 300 measures the performance of Europe’s largest 300 companies by market capitalization and covers 70% of Europe’s market cap. The CAC-40 Index is a narrow-based, modified capitalization-weighted index of 40 companies listed on the Paris Bourse. The MICEX 10 Index (Russian: Индекс ММВБ10) is an unweighted price index that tracks the ten most liquid Russian stocks listed on MICEX-RTS in Moscow. The Korea Composite Stock Price Index or KOSPI is the major stock market index of South Korea, representing all common stocks traded on the Korea Exchange. The MERVAL Index (MERcado de VALores, literally Stock Exchange) is the most important index of the Buenos Aires Stock Exchange. The Hang Seng Index is a free float-adjusted market capitalization-weighted stock market index that is the main indicator of the overall market performance in Hong Kong. The BSE SENSEX (Bombay Stock Exchange Sensitive Index), also-called the BSE 30 (BOMBAY STOCK EXCHANGE) or simply the SENSEX, is a free-float market capitalization-weighted stock market index of 30 well-established and financially sound companies listed on the Bombay Stock Exchange (BSE). The NIFTY 50 is a diversified 50-stock index accounting for 12 sectors of the Indian economy. The MSCI Emerging Markets Index is a float-adjusted market capitalization index consisting of indices in more than 25 emerging economies. Nikkei 225 (Ticker: ^N225) is a stock market index for the Tokyo Stock Exchange (TSE). The Nikkei average is the most watched index of Asian stocks. The FTSE TWSE Taiwan 50 Index consists of the largest 50 companies by full market value, and is also the first narrow-based index published in Taiwan. The MSCI World Index is a free-float weighted equity index that includes developed world markets, and does not include emerging markets. The Mexican Stock Exchange, commonly known as Mexican Bolsa, Mexbol, or BMV, is the only stock exchange in Mexico. The SSE Composite Index is an index of all stocks (A shares and B shares) that are traded at the Shanghai Stock Exchange. The S&P/TSX Composite Index is an index of the stock (equity) prices of the largest companies on the Toronto Stock Exchange (TSX) as measured by market capitalization. The Bovespa Index is a gross total return index weighted by traded volume & is comprised of the most liquid stocks traded on the Sao Paulo Stock Exchange. The All Ordinaries (XAO) is considered a total market barometer for the Australian stock market and contains the 500 largest ASX-listed companies by way of market capitalization. The US Dollar Index measures the performance of the U.S. dollar against a basket of six currencies. Additional risks are associated with international investing, such as currency fluctuations, political and economic instability and differences in accounting standards. This material represents an assessment of the market environment at a specific point in time and is not intended to be a forecast of future events, or a guarantee of future results. MarketingPro, Inc. is not affiliated with any person or firm that may be providing this information to you. The publisher is not engaged in rendering legal, accounting or other professional services. If assistance is needed, the reader is advised to engage the services of a competent professional.
Citations.
1 – barchart.com/stocks/indices#/viewName=performance [5/31/17]
2 – cnbc.com/2017/05/05/nonfarm-payrolls-april-2017.html [5/5/17]
3 – investing.com/economic-calendar/ [5/31/17]
4 – nytimes.com/2017/05/24/business/economy/fed-interest-rates-minutes.html [5/24/17]
5 – cnbc.com/2017/06/01/may-ism-manufacturing-index.html [6/1/17]
6 – tradingeconomics.com/united-states/non-manufacturing-pmi [5/31/17]
7 – ec.europa.eu/eurostat [5/31/17]
8 – marketwatch.com/story/european-stocks-rise-as-eurozone-economic-activity-hovers-at-6-year-high-2017-05-23 [5/23/17]
9 – bloomberg.com/news/articles/2017-05-31/china-manufacturing-gauge-exceeds-estimates-as-growth-holds-up [5/31/17]
10 – in.reuters.com/article/asia-economy-gdp-idINL4N1IK1JC [5/18/17]
11 – markets.on.nytimes.com/research/markets/worldmarkets/worldmarkets.asp [5/31/17]
12 – msci.com/end-of-day-data-search [5/31/17]
13 – money.cnn.com/data/commodities/ [5/31/17]
14 – marketwatch.com/investing/index/dxy/historical [5/31/17]
15 – builderonline.com/money/affordability/home-prices-continue-rise-in-march_o [5/30/17]
16 – freddiemac.com/pmms/archive.html?year=2017 [5/31/17]
17 – bigcharts.marketwatch.com/historical/default.asp?symb=DJIA&closeDate=5%2F31%2F16&x=0&y=0 [5/31/17]
17 – bigcharts.marketwatch.com/historical/default.asp?symb=COMP&closeDate=5%2F31%2F16&x=0&y=0 [5/31/17]
17 – bigcharts.marketwatch.com/historical/default.asp?symb=SPX&closeDate=5%2F31%2F16&x=0&y=0 [5/31/17]
17 – bigcharts.marketwatch.com/historical/default.asp?symb=DJIA&closeDate=5%2F31%2F12&x=0&y=0 [5/31/17]
17 – bigcharts.marketwatch.com/historical/default.asp?symb=COMP&closeDate=5%2F31%2F12&x=0&y=0 [5/31/17]
17 – bigcharts.marketwatch.com/historical/default.asp?symb=SPX&closeDate=5%2F31%2F12&x=0&y=0 [5/31/17]
17 – bigcharts.marketwatch.com/historical/default.asp?symb=DJIA&closeDate=5%2F31%2F07&x=0&y=0 [5/31/17]
17 – bigcharts.marketwatch.com/historical/default.asp?symb=COMP&closeDate=5%2F31%2F07&x=0&y=0 [5/31/17]
17 – bigcharts.marketwatch.com/historical/default.asp?symb=SPX&closeDate=5%2F31%2F07&x=0&y=0 [5/31/17]
18 – treasury.gov/resource-center/data-chart-center/interest-rates/Pages/TextView.aspx?data=realyield [5/31/17]
19 – treasury.gov/resource-center/data-chart-center/interest-rates/Pages/TextView.aspx?data=realyieldAll [5/31/17]
20 – https://www.barrons.com/articles/battle-lines-dow-ends-may-higher-what-will-june-bring-1496267260 [5/31/17]
Other Information:
Adams Wealth Management Group LLC (“Adams Wealth Management”) is a registered investment adviser offering advisory services in the State of Texas and in other jurisdictions where exempted. Registration does not imply a certain level of skill or training. The presence of this website on the Internet shall not be directly or indirectly interpreted as a solicitation of investment advisory services to persons of another jurisdiction unless otherwise permitted by statute. Follow-up or individualized responses to consumers in a particular state by Adams Wealth Management in the rendering of personalized investment advice for compensation shall not be made without our first complying with jurisdiction requirements or pursuant an applicable state exemption.
All written content on this site is for information purposes only. Opinions expressed herein are solely those of Adams Wealth Management, unless otherwise specifically cited. Material presented is believed to be from reliable sources and no representations are made by our firm as to another parties’ informational accuracy or completeness. All information or ideas provided should be discussed in detail with an advisor, accountant or legal counsel prior to implementation.
All investing involves risk, including the potential for loss of principal. There is no guarantee that any investment strategy or plan will be successful.
