
QUOTE OF THE QUARTER
“To fulfill a dream, to be allowed to sweat over lonely labor, to be given the chance to create, is the meat and potatoes of life. The money is the gravy.”
– Bette Davis
QUARTERLY TIP
New parents should strive to insure themselves. That means life insurance coverage for both spouses or partners. In the event of one spouse or partner’s untimely death, life insurance benefits may replace lost income and help the surviving parent pay for child care costs.
THE QUARTER IN BRIEF
After a remarkable first quarter, the stock market cooled off slightly in Q2 – but investors still saw substantial gains. Strong earnings helped take Wall Street’s collective mind off a decidedly mixed bag of economic signals. Consumers remained confident as the quarter unfolded; although hiring, inflation, and consumer spending weakened. Home sales declined, then rebounded. Overseas, factory activity in China and the eurozone showed improvement, and foreign equity benchmarks continued climbing. Many commodities took sizable Q2 losses. When the quarter ended, the bulls were still firmly in charge.(1)
DOMESTIC ECONOMIC HEALTH
As one quarter ends, the Bureau of Economic Analysis commonly makes its third and last assessment of the prior quarter’s economic growth (though, even this “final” estimate may be adjusted in later years). In the last week of June, the BEA announced a “final” Q1 growth number of 1.4%, which was nothing to celebrate. Would Q2 growth come in above 2%?(2)
Second-quarter consumer spending data from the Department of Commerce raised some concerns about reaching that percentage of growth. While April and May brought solid growth for personal incomes (0.3% in the former month and 0.4% in the latter), the gain in personal spending fell from 0.4%, in the fourth month of the year, to 0.1%, in the fifth. Retail sales, too, tailed off: after rising a robust 0.4% in April, they fell 0.3% for May.(2)
More from Adams Wealth Management.
Understanding 401(k) Rollovers
Households did feel good about the state of the economy and their financial prospects. At final readings of 97.0 in April, 97.1 in May, and 95.1 in June, the University of Michigan’s consumer sentiment index stayed well north of its 86.1 historical average. The Conference Board’s index ended the quarter at a very high mark of 118.9.(2,3)
Hiring figures from the Department of Labor were somewhat weak. Monthly employment reports showed that U.S. firms added 174,000 net new jobs in April and 138,000 net new jobs in May. (In March, the number had been just 50,000.) Was the job market simply at capacity? Only time would tell. Reductions in the labor force participation rate helped send both the headline jobless rate and the U-6 rate, factoring in the underemployed, to notable lows. By June, the headline (U-3) rate had dipped to 4.3%, a level unseen in 16 years; the U-6 rate had fallen to a 10-year low of 8.4%.(4)
On the manufacturing front, the news appeared better. The Institute for Supply Management’s factory purchasing manager index rose to 57.8 in June, a 34-month peak. This was after readings of 54.8 in April and 54.9 in May. ISM’s service sector PMI was also well above the expansion line of 50 in April and May, displaying respective readings of 57.5 and 56.9 in those months.(5,6)
Still, federal government reports showed manufacturing and industry production falling off in Q2. Industrial output jumped 1.1% in April; then, flattened in May. Manufacturing output went from a 1.1% gain to a 0.4% retreat. Hard goods orders were down 0.9% in April; then, down 1.1% a month later.(2)
Annualized inflation declined during the quarter. The May Consumer Price Index showed only a 12-month gain of 1.9% and just 1.7% for core prices. A month earlier, yearly inflation had been at 2.2% with the core CPI rising 1.9%. Did wholesale inflation also lessen? The headline number did, ticking down 0.1% in May to 2.4%. The core Producer Price Index was up 2.1% year-over-year through May, a 0.2% increase from April.(2)
The Federal Reserve lifted the federal funds rate by another quarter point in June to a target range of 1.00-1.25%. It also disclosed it would begin reducing its massive bond portfolio “this year,” which could put pressure on long-term interest rates. The central bank intends to let $6 billion of Treasuries and $4 billion per month in agency debt and mortgage-linked securities mature per month to start. In late June, all 34 of the country’s largest banks passed the Fed’s annual stress tests – a milestone unseen since their adoption seven years ago.(7,8)
GLOBAL ECONOMIC HEALTH
Emmanuel Macron’s decisive victory in France’s national election cheered investors concerned about the potential for another crack in the European Union, and it started a rally in the euro, which continued in June after European Central Bank President Mario Draghi commented that “the threat of deflation is gone and reflationary forces are at play.” Investors took those words as a strong hint that the ECB would presently end its quantitative easing. As the quarter concluded, Chancellor Angela Merkel’s reelection seemed probable in Germany; a fourth Merkel term would be another boost to EU economic confidence and stability.(1,9)
Manufacturing economies accelerated around the world in the quarter. The Markit eurozone factory PMI reached 57.0 in May, and then, 57.4 in June (a 4-year peak). Manufacturing PMIs in Vietnam, India, South Korea, Taiwan, and Japan were all above 50 (the level signifying sector expansion) as Q2 wrapped up. China’s official factory PMI was at 51.2 in May; then, 51.7 in June. Its official service sector PMI came in at 54.5 in May and 54.9 in June.(10,11)
WORLD MARKETS
One factoid conveys how well global equity benchmarks did in 2017’s first half: 26 of the world’s 30 major indices posted 6-month gains. The last time that happened was in 2009 – and it has only occurred in four other similar intervals within the past two decades.(12)
Germany’s DAX finished the first half up an impressive 7.4% YTD, and France’s CAC 40 was up 5.3% on the year when Q2 ended. The United Kingdom’s FTSE 100 was 2.4% higher YTD on June 30. India’s Sensex topped the 31,000 level in June, reaching an all-time peak and outdistancing nearly all of its nearby Asia-Pacific benchmarks with an astounding 16.1% first-half advance. The Nikkei Asia300 index did even better, ending the first half of 2017 up more than 21% YTD.(13,14)
Looking at some regional indexes, the pan-Europe Stoxx 600 index fell 0.5% in Q2, but still had risen 5.0% YTD through June. The MSCI World Index advanced 3.4% in the quarter, to go up 9.4% for the year; MSCI’s Emerging Markets benchmark rose 5.5% in Q2, taking its YTD gain to an impressive 17.22%.(13,15)
COMMODITIES MARKETS
Oil traded under $50 for most of the second quarter, touching a low of $42.05 before rising to finish Q2 at $46.33 on the NYMEX. Gold ended June at $1,241.40; silver, at $16.57.(1,16)
Losers outnumbered winners in the commodity sector in Q2, and some commodities took steep falls. Iron ore slid 21.37% in the quarter; sugar, 17.60%; gasoline, 11.16%; coffee, 10.95%. Other notable losses came for silver, oil, and cocoa, which were all down between 9-10% for the quarter; heating oil and natural gas gave back roughly 5%. Among the big Q2 winners: oats, up 29.32%; CBOT wheat, up 19.81%; feeder cattle, up 10.43%. Palladium picked up 4.78%; soybean oil; 3.62%; corn; 1.72%; copper, 1.66%.(1)
The animal protein and grain sectors were the best-performing portions of the commodities market in the quarter, respectively gaining 15.13% and 13.34%. The energy sector fell 7.61%; the precious metals sector, 2.09%; the base metals sector, 1.75%.(1)
REAL ESTATE
Home buying slumped in April and then rebounded during May. In the fourth month of the year, the National Association of Realtors calculated a 2.5% decline in resales – but a 1.1% May gain left them 2.7% improved over the past 12 months. That May gain happened with inventory down 8.4% year-over-year and a median existing home price 5.8% higher ($252,800) than a year before. The Census Bureau said that new home sales dropped 7.9% in April, but they rose 2.9% a month later.(2,17)
Cheap mortgages were certainly a plus. In Freddie Mac’s March 30 Primary Mortgage Market Survey, mortgage types bore the following average interest rates: 30-year fixed, 4.14%; 15-year fixed, 3.39%; 5/1-year adjustable, 3.18%. Freddie’s June 29 survey showed the following averages: 30-year fixed, 3.88%; 15-year fixed, 3.17%; 5/1-year adjustable, 3.17%.(18)
Three other closely-watched housing market indicators weakened in Q2. The Census Bureau’s monthly snapshot of housing starts and building permits showed starts down 2.8% in April and 5.5% in May as well as permits slipping 2.5% for April and 4.9% for May. The year-over-year advance on the 20-city composite S&P/Case-Shiller home price index was 5.9% in the March edition and 5.7% in the April edition (this is a famously lagging indicator). Finally, NAR’s pending home sales index took two small steps back, retreating 1.7% in April and 0.8% in May.(2)
LOOKING BACK…LOOKING FORWARD
A sustained rally with only brief, minor setbacks left the notable U.S. equity and volatility indices at the following levels at the end of Q2: S&P 500, 2,423.41; Dow Jones Industrial Average, 21,349.63; Russell 2000, 1,415.36; Nasdaq Composite, 6,140.42; CBOE VIX, 11.18. The quarterly gains for the big three are noted below; the Russell advanced 2.39% in three months, while the VIX fell 3.12%. The PHLX Oil Service Sector index brought up the rear among U.S. equity indices, staggering to a 22.54% 3-month loss.(19)
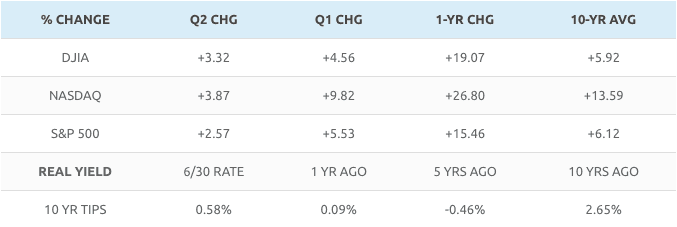
Sources: seekingalpha.com, barchart.com, bigcharts.com, treasury.gov – 6/30/17(1,20,21,22)
Indices are unmanaged, do not incur fees or expenses, and cannot be invested into directly. These returns do not include dividends. 10-year TIPS real yield = projected return at maturity given expected inflation.
However you see your tomorrow, the best time to plan for it is today.
With the three marquee U.S. equity indices up between 15-27% in 12 months, investors are naturally skeptical about how long stocks can maintain such powerful momentum. Bulls still rule the Street, though – and bullish analysts see more upside to this market during the rest of 2017. It is true that past performance is no guarantee of future success, but the major Wall Street indices have tended to have a good second half in the past 20 years, regardless of their first-half performance. The Dow and Nasdaq have posted second-half advances during 14 of the past 20 years, and the S&P 500 has followed suit in 13 of the past 20 years. Looking closer at the years featuring these advances, the average second-half rise was 4.31% for the Nasdaq, 3.23% for the Dow, and 2.68% for the S&P. Since 1988, the S&P has never retreated during the second half of a year when it has gained 6% or more in a first half. So, in recent stock market history, when the bulls have been ruling the Street in the first half of a year, they have tended to keep running the rest of the year. Bears might say that the bulls who embrace these statistics are suffering from recency bias, and perhaps, that argument has merit. Then again, bearish analysts have predicted an end to this bull market year after year, and still, it persists.(23)
This material was prepared by MarketingPro, Inc., and does not necessarily represent the views of the presenting party, nor their affiliates. The information herein has been derived from sources believed to be accurate. Please note – investing involves risk, and past performance is no guarantee of future results. Investments will fluctuate and when redeemed may be worth more or less than when originally invested. This information should not be construed as investment, tax or legal advice and may not be relied on for the purpose of avoiding any Federal tax penalty. This is neither a solicitation nor recommendation to purchase or sell any investment or insurance product or service, and should not be relied upon as such. Indices do not incur management fees, costs and expenses, and cannot be invested into directly. All economic and performance data is historical and not indicative of future results. The Dow Jones Industrial Average is a price-weighted index of 30 actively traded blue-chip stocks. The NASDAQ Composite Index is a market-weighted index of all over-the-counter common stocks traded on the National Association of Securities Dealers Automated Quotation System. The Standard & Poor’s 500 (S&P 500) is a market-cap weighted index composed of the common stocks of 500 leading companies in leading industries of the U.S. economy. NYSE Group, Inc. (NYSE:NYX) operates two securities exchanges: the New York Stock Exchange (the “NYSE”) and NYSE Arca (formerly known as the Archipelago Exchange, or ArcaEx®, and the Pacific Exchange). NYSE Group is a leading provider of securities listing, trading and market data products and services. The New York Mercantile Exchange, Inc. (NYMEX) is the world’s largest physical commodity futures exchange and the preeminent trading forum for energy and precious metals, with trading conducted through two divisions – the NYMEX Division, home to the energy, platinum, and palladium markets, and the COMEX Division, on which all other metals trade. The DAX 30 is a Blue Chip stock market index consisting of the 30 major German companies trading on the Frankfurt Stock Exchange. The CAC-40 Index is a narrow-based, modified capitalization-weighted index of 40 companies listed on the Paris Bourse. The STOXX Europe 600 Index is derived from the STOXX Europe Total Market Index (TMI) and is a subset of the STOXX Global 1800 Index. The FTSE 100 Index is a share index of the 100 most highly capitalized companies listed on the London Stock Exchange. BSE Sensex or Bombay Stock Exchange Sensitivity Index is a value-weighted index composed of 30 stocks that started January 1, 1986. The Nikkei Asia300 Index is based on the “Asia300” group of must-watch companies selected by Nikkei. The composite index is supplemented by an index focusing specifically on companies in the ASEAN region, as well as individual indexes for 11 countries and regions. The MSCI World Index is a free-float weighted equity index that includes developed world markets, and does not include emerging markets. The MSCI Emerging Markets Index is a float-adjusted market capitalization index consisting of indices in more than 25 emerging economies. The Russell 2000 Index is a small-cap stock market index of the bottom 2,000 stocks in the Russell 3000 Index. The CBOE Volatility Index® is a key measure of market expectations of near-term volatility conveyed by S&P 500 stock index option prices. The PHLX Oil Service Sector Index (OSX) is a modified market weighted index composed of companies involved in the oil services sector. Additional risks are associated with international investing, such as currency fluctuations, political and economic instability and differences in accounting standards. This material represents an assessment of the market environment at a specific point in time and is not intended to be a forecast of future events, or a guarantee of future results. MarketingPro, Inc. is not affiliated with any person or firm that may be providing this information to you. The publisher is not engaged in rendering legal, accounting or other professional services. If assistance is needed, the reader is advised to engage the services of a competent.
Citations.
1 – seekingalpha.com/article/4085358-commodities-second-quarter-overview-outlook [7/3/17]
2 – investing.com/economic-calendar/ [6/30/17]
3 – tradingeconomics.com/united-states/consumer-confidence [7/4/17]
4 – nytimes.com/2017/06/02/business/economy/jobs-report.html [6/2/17]
5 – cnbc.com/2017/07/03/june-ism-manufacturing-index.html [7/3/17]
6 – instituteforsupplymanagement.org/ISMReport/NonMfgROB.cfm [6/5/17]
7 – forbes.com/sites/laurengensler/2017/06/14/fed-raises-rates-june/ [6/14/17]
8 – money.cnn.com/2017/06/28/news/economy/fed-stress-test-wall-street-results/index.html [6/28/17]
9 – investors.com/news/draghi-drama-undercuts-key-stock-market-support/ [6/29/17]
10 – nytimes.com/reuters/2017/07/03/business/03reuters-global-economy.html [7/3/17]
11 – cnbc.com/2017/06/29/china-manufacturing-accelerates-in-june-with-official-pmi-at-51-point-7-beating-expectations-for-51-point-0.html [6/29/17]
12 – ig.com/au/view-ig/2017/07/04/stock-markets-in-2017–a-good-first-half-38915 [7/4/17]
13 – foxbusiness.com/features/2017/06/30/europe-markets-european-stocks-close-in-red-germanys-dax-hobbled-by-bayer.html [6/30/17]
14 – asia.nikkei.com/Business/AC/Bets-on-Modi-s-reforms-help-India-stocks-beat-peers-in-first-half [6/30/17]
15 – msci.com/end-of-day-data-search [6/30/17]
16 – money.cnn.com/data/commodities/ [6/30/17]
17 – inman.com/2017/06/21/consumer-resilience-boosts-may-existing-home-sales/ [6/26/17]
18 – freddiemac.com/pmms/archive.html [7/4/17]
19 – barchart.com/stocks/indices#/viewName=performance [6/30/17]
20 – barchart.com/stocks/indices#/viewName=performance [3/31/17]
21 – bigcharts.marketwatch.com/historical/default.asp?symb=DJIA&closeDate=6%2F30%2F16&x=0&y=0 [6/30/17]
21 – bigcharts.marketwatch.com/historical/default.asp?symb=COMP&closeDate=6%2F30%2F16&x=0&y=0 [6/30/17]
21 – bigcharts.marketwatch.com/historical/default.asp?symb=SPX&closeDate=6%2F30%2F16&x=0&y=0 [6/30/17]
21 – bigcharts.marketwatch.com/historical/default.asp?symb=DJIA&closeDate=6%2F29%2F07&x=0&y=0 [6/30/17]
21 – bigcharts.marketwatch.com/historical/default.asp?symb=COMP&closeDate=6%2F29%2F07&x=0&y=0 [6/30/17]
21 – bigcharts.marketwatch.com/historical/default.asp?symb=SPX&closeDate=6%2F29%2F07&x=0&y=0 [6/30/17]
22 – treasury.gov/resource-center/data-chart-center/interest-rates/Pages/TextView.aspx?data=realyieldAll [7/3/17]
23 – cnbc.com/2017/06/30/chances-for-second-half-stock-market-gains-are-good.html [6/30/17]
Other Information:
Adams Wealth Management Group LLC (“Adams Wealth Management”) is a registered investment adviser offering advisory services in the State of Texas and in other jurisdictions where exempted. Registration does not imply a certain level of skill or training. The presence of this website on the Internet shall not be directly or indirectly interpreted as a solicitation of investment advisory services to persons of another jurisdiction unless otherwise permitted by statute. Follow-up or individualized responses to consumers in a particular state by Adams Wealth Management in the rendering of personalized investment advice for compensation shall not be made without our first complying with jurisdiction requirements or pursuant an applicable state exemption.
All written content on this site is for information purposes only. Opinions expressed herein are solely those of Adams Wealth Management, unless otherwise specifically cited. Material presented is believed to be from reliable sources and no representations are made by our firm as to another parties’ informational accuracy or completeness. All information or ideas provided should be discussed in detail with an advisor, accountant or legal counsel prior to implementation.
All investing involves risk, including the potential for loss of principal. There is no guarantee that any investment strategy or plan will be successful.
THE QUARTER IN BRIEF
After a remarkable first quarter, the stock market cooled off slightly in Q2 – but investors still saw substantial gains. Strong earnings helped take Wall Street’s collective mind off a decidedly mixed bag of economic signals. Consumers remained confident as the quarter unfolded; although hiring, inflation, and consumer spending weakened. Home sales declined, then rebounded. Overseas, factory activity in China and the eurozone showed improvement, and foreign equity benchmarks continued climbing. Many commodities took sizable Q2 losses. When the quarter ended, the bulls were still firmly in charge.(1)
DOMESTIC ECONOMIC HEALTH
As one quarter ends, the Bureau of Economic Analysis commonly makes its third and last assessment of the prior quarter’s economic growth (though, even this “final” estimate may be adjusted in later years). In the last week of June, the BEA announced a “final” Q1 growth number of 1.4%, which was nothing to celebrate. Would Q2 growth come in above 2%?(2)
Second-quarter consumer spending data from the Department of Commerce raised some concerns about reaching that percentage of growth. While April and May brought solid growth for personal incomes (0.3% in the former month and 0.4% in the latter), the gain in personal spending fell from 0.4%, in the fourth month of the year, to 0.1%, in the fifth. Retail sales, too, tailed off: after rising a robust 0.4% in April, they fell 0.3% for May.(2)
More from Adams Wealth Management.
Understanding 401(k) Rollovers
Households did feel good about the state of the economy and their financial prospects. At final readings of 97.0 in April, 97.1 in May, and 95.1 in June, the University of Michigan’s consumer sentiment index stayed well north of its 86.1 historical average. The Conference Board’s index ended the quarter at a very high mark of 118.9.(2,3)
Hiring figures from the Department of Labor were somewhat weak. Monthly employment reports showed that U.S. firms added 174,000 net new jobs in April and 138,000 net new jobs in May. (In March, the number had been just 50,000.) Was the job market simply at capacity? Only time would tell. Reductions in the labor force participation rate helped send both the headline jobless rate and the U-6 rate, factoring in the underemployed, to notable lows. By June, the headline (U-3) rate had dipped to 4.3%, a level unseen in 16 years; the U-6 rate had fallen to a 10-year low of 8.4%.(4)
On the manufacturing front, the news appeared better. The Institute for Supply Management’s factory purchasing manager index rose to 57.8 in June, a 34-month peak. This was after readings of 54.8 in April and 54.9 in May. ISM’s service sector PMI was also well above the expansion line of 50 in April and May, displaying respective readings of 57.5 and 56.9 in those months.(5,6)
Still, federal government reports showed manufacturing and industry production falling off in Q2. Industrial output jumped 1.1% in April; then, flattened in May. Manufacturing output went from a 1.1% gain to a 0.4% retreat. Hard goods orders were down 0.9% in April; then, down 1.1% a month later.(2)
Annualized inflation declined during the quarter. The May Consumer Price Index showed only a 12-month gain of 1.9% and just 1.7% for core prices. A month earlier, yearly inflation had been at 2.2% with the core CPI rising 1.9%. Did wholesale inflation also lessen? The headline number did, ticking down 0.1% in May to 2.4%. The core Producer Price Index was up 2.1% year-over-year through May, a 0.2% increase from April.(2)
The Federal Reserve lifted the federal funds rate by another quarter point in June to a target range of 1.00-1.25%. It also disclosed it would begin reducing its massive bond portfolio “this year,” which could put pressure on long-term interest rates. The central bank intends to let $6 billion of Treasuries and $4 billion per month in agency debt and mortgage-linked securities mature per month to start. In late June, all 34 of the country’s largest banks passed the Fed’s annual stress tests – a milestone unseen since their adoption seven years ago.(7,8)
GLOBAL ECONOMIC HEALTH
Emmanuel Macron’s decisive victory in France’s national election cheered investors concerned about the potential for another crack in the European Union, and it started a rally in the euro, which continued in June after European Central Bank President Mario Draghi commented that “the threat of deflation is gone and reflationary forces are at play.” Investors took those words as a strong hint that the ECB would presently end its quantitative easing. As the quarter concluded, Chancellor Angela Merkel’s reelection seemed probable in Germany; a fourth Merkel term would be another boost to EU economic confidence and stability.(1,9)
Manufacturing economies accelerated around the world in the quarter. The Markit eurozone factory PMI reached 57.0 in May, and then, 57.4 in June (a 4-year peak). Manufacturing PMIs in Vietnam, India, South Korea, Taiwan, and Japan were all above 50 (the level signifying sector expansion) as Q2 wrapped up. China’s official factory PMI was at 51.2 in May; then, 51.7 in June. Its official service sector PMI came in at 54.5 in May and 54.9 in June.(10,11)
WORLD MARKETS
One factoid conveys how well global equity benchmarks did in 2017’s first half: 26 of the world’s 30 major indices posted 6-month gains. The last time that happened was in 2009 – and it has only occurred in four other similar intervals within the past two decades.(12)
Germany’s DAX finished the first half up an impressive 7.4% YTD, and France’s CAC 40 was up 5.3% on the year when Q2 ended. The United Kingdom’s FTSE 100 was 2.4% higher YTD on June 30. India’s Sensex topped the 31,000 level in June, reaching an all-time peak and outdistancing nearly all of its nearby Asia-Pacific benchmarks with an astounding 16.1% first-half advance. The Nikkei Asia300 index did even better, ending the first half of 2017 up more than 21% YTD.(13,14)
Looking at some regional indexes, the pan-Europe Stoxx 600 index fell 0.5% in Q2, but still had risen 5.0% YTD through June. The MSCI World Index advanced 3.4% in the quarter, to go up 9.4% for the year; MSCI’s Emerging Markets benchmark rose 5.5% in Q2, taking its YTD gain to an impressive 17.22%.(13,15)
COMMODITIES MARKETS
Oil traded under $50 for most of the second quarter, touching a low of $42.05 before rising to finish Q2 at $46.33 on the NYMEX. Gold ended June at $1,241.40; silver, at $16.57.(1,16)
Losers outnumbered winners in the commodity sector in Q2, and some commodities took steep falls. Iron ore slid 21.37% in the quarter; sugar, 17.60%; gasoline, 11.16%; coffee, 10.95%. Other notable losses came for silver, oil, and cocoa, which were all down between 9-10% for the quarter; heating oil and natural gas gave back roughly 5%. Among the big Q2 winners: oats, up 29.32%; CBOT wheat, up 19.81%; feeder cattle, up 10.43%. Palladium picked up 4.78%; soybean oil; 3.62%; corn; 1.72%; copper, 1.66%.(1)
The animal protein and grain sectors were the best-performing portions of the commodities market in the quarter, respectively gaining 15.13% and 13.34%. The energy sector fell 7.61%; the precious metals sector, 2.09%; the base metals sector, 1.75%.(1)
REAL ESTATE
Home buying slumped in April and then rebounded during May. In the fourth month of the year, the National Association of Realtors calculated a 2.5% decline in resales – but a 1.1% May gain left them 2.7% improved over the past 12 months. That May gain happened with inventory down 8.4% year-over-year and a median existing home price 5.8% higher ($252,800) than a year before. The Census Bureau said that new home sales dropped 7.9% in April, but they rose 2.9% a month later.(2,17)
Cheap mortgages were certainly a plus. In Freddie Mac’s March 30 Primary Mortgage Market Survey, mortgage types bore the following average interest rates: 30-year fixed, 4.14%; 15-year fixed, 3.39%; 5/1-year adjustable, 3.18%. Freddie’s June 29 survey showed the following averages: 30-year fixed, 3.88%; 15-year fixed, 3.17%; 5/1-year adjustable, 3.17%.(18)
Three other closely-watched housing market indicators weakened in Q2. The Census Bureau’s monthly snapshot of housing starts and building permits showed starts down 2.8% in April and 5.5% in May as well as permits slipping 2.5% for April and 4.9% for May. The year-over-year advance on the 20-city composite S&P/Case-Shiller home price index was 5.9% in the March edition and 5.7% in the April edition (this is a famously lagging indicator). Finally, NAR’s pending home sales index took two small steps back, retreating 1.7% in April and 0.8% in May.(2)
LOOKING BACK…LOOKING FORWARD
A sustained rally with only brief, minor setbacks left the notable U.S. equity and volatility indices at the following levels at the end of Q2: S&P 500, 2,423.41; Dow Jones Industrial Average, 21,349.63; Russell 2000, 1,415.36; Nasdaq Composite, 6,140.42; CBOE VIX, 11.18. The quarterly gains for the big three are noted below; the Russell advanced 2.39% in three months, while the VIX fell 3.12%. The PHLX Oil Service Sector index brought up the rear among U.S. equity indices, staggering to a 22.54% 3-month loss.(19)
Sources: seekingalpha.com, barchart.com, bigcharts.com, treasury.gov – 6/30/17(1,20,21,22)
Indices are unmanaged, do not incur fees or expenses, and cannot be invested into directly. These returns do not include dividends. 10-year TIPS real yield = projected return at maturity given expected inflation.
However you see your tomorrow, the best time to plan for it is today.
With the three marquee U.S. equity indices up between 15-27% in 12 months, investors are naturally skeptical about how long stocks can maintain such powerful momentum. Bulls still rule the Street, though – and bullish analysts see more upside to this market during the rest of 2017. It is true that past performance is no guarantee of future success, but the major Wall Street indices have tended to have a good second half in the past 20 years, regardless of their first-half performance. The Dow and Nasdaq have posted second-half advances during 14 of the past 20 years, and the S&P 500 has followed suit in 13 of the past 20 years. Looking closer at the years featuring these advances, the average second-half rise was 4.31% for the Nasdaq, 3.23% for the Dow, and 2.68% for the S&P. Since 1988, the S&P has never retreated during the second half of a year when it has gained 6% or more in a first half. So, in recent stock market history, when the bulls have been ruling the Street in the first half of a year, they have tended to keep running the rest of the year. Bears might say that the bulls who embrace these statistics are suffering from recency bias, and perhaps, that argument has merit. Then again, bearish analysts have predicted an end to this bull market year after year, and still, it persists.(23)
This material was prepared by MarketingPro, Inc., and does not necessarily represent the views of the presenting party, nor their affiliates. The information herein has been derived from sources believed to be accurate. Please note – investing involves risk, and past performance is no guarantee of future results. Investments will fluctuate and when redeemed may be worth more or less than when originally invested. This information should not be construed as investment, tax or legal advice and may not be relied on for the purpose of avoiding any Federal tax penalty. This is neither a solicitation nor recommendation to purchase or sell any investment or insurance product or service, and should not be relied upon as such. Indices do not incur management fees, costs and expenses, and cannot be invested into directly. All economic and performance data is historical and not indicative of future results. The Dow Jones Industrial Average is a price-weighted index of 30 actively traded blue-chip stocks. The NASDAQ Composite Index is a market-weighted index of all over-the-counter common stocks traded on the National Association of Securities Dealers Automated Quotation System. The Standard & Poor’s 500 (S&P 500) is a market-cap weighted index composed of the common stocks of 500 leading companies in leading industries of the U.S. economy. NYSE Group, Inc. (NYSE:NYX) operates two securities exchanges: the New York Stock Exchange (the “NYSE”) and NYSE Arca (formerly known as the Archipelago Exchange, or ArcaEx®, and the Pacific Exchange). NYSE Group is a leading provider of securities listing, trading and market data products and services. The New York Mercantile Exchange, Inc. (NYMEX) is the world’s largest physical commodity futures exchange and the preeminent trading forum for energy and precious metals, with trading conducted through two divisions – the NYMEX Division, home to the energy, platinum, and palladium markets, and the COMEX Division, on which all other metals trade. The DAX 30 is a Blue Chip stock market index consisting of the 30 major German companies trading on the Frankfurt Stock Exchange. The CAC-40 Index is a narrow-based, modified capitalization-weighted index of 40 companies listed on the Paris Bourse. The STOXX Europe 600 Index is derived from the STOXX Europe Total Market Index (TMI) and is a subset of the STOXX Global 1800 Index. The FTSE 100 Index is a share index of the 100 most highly capitalized companies listed on the London Stock Exchange. BSE Sensex or Bombay Stock Exchange Sensitivity Index is a value-weighted index composed of 30 stocks that started January 1, 1986. The Nikkei Asia300 Index is based on the “Asia300” group of must-watch companies selected by Nikkei. The composite index is supplemented by an index focusing specifically on companies in the ASEAN region, as well as individual indexes for 11 countries and regions. The MSCI World Index is a free-float weighted equity index that includes developed world markets, and does not include emerging markets. The MSCI Emerging Markets Index is a float-adjusted market capitalization index consisting of indices in more than 25 emerging economies. The Russell 2000 Index is a small-cap stock market index of the bottom 2,000 stocks in the Russell 3000 Index. The CBOE Volatility Index® is a key measure of market expectations of near-term volatility conveyed by S&P 500 stock index option prices. The PHLX Oil Service Sector Index (OSX) is a modified market weighted index composed of companies involved in the oil services sector. Additional risks are associated with international investing, such as currency fluctuations, political and economic instability and differences in accounting standards. This material represents an assessment of the market environment at a specific point in time and is not intended to be a forecast of future events, or a guarantee of future results. MarketingPro, Inc. is not affiliated with any person or firm that may be providing this information to you. The publisher is not engaged in rendering legal, accounting or other professional services. If assistance is needed, the reader is advised to engage the services of a competent.
Citations.
1 – seekingalpha.com/article/4085358-commodities-second-quarter-overview-outlook [7/3/17]
2 – investing.com/economic-calendar/ [6/30/17]
3 – tradingeconomics.com/united-states/consumer-confidence [7/4/17]
4 – nytimes.com/2017/06/02/business/economy/jobs-report.html [6/2/17]
5 – cnbc.com/2017/07/03/june-ism-manufacturing-index.html [7/3/17]
6 – instituteforsupplymanagement.org/ISMReport/NonMfgROB.cfm [6/5/17]
7 – forbes.com/sites/laurengensler/2017/06/14/fed-raises-rates-june/ [6/14/17]
8 – money.cnn.com/2017/06/28/news/economy/fed-stress-test-wall-street-results/index.html [6/28/17]
9 – investors.com/news/draghi-drama-undercuts-key-stock-market-support/ [6/29/17]
10 – nytimes.com/reuters/2017/07/03/business/03reuters-global-economy.html [7/3/17]
11 – cnbc.com/2017/06/29/china-manufacturing-accelerates-in-june-with-official-pmi-at-51-point-7-beating-expectations-for-51-point-0.html [6/29/17]
12 – ig.com/au/view-ig/2017/07/04/stock-markets-in-2017–a-good-first-half-38915 [7/4/17]
13 – foxbusiness.com/features/2017/06/30/europe-markets-european-stocks-close-in-red-germanys-dax-hobbled-by-bayer.html [6/30/17]
14 – asia.nikkei.com/Business/AC/Bets-on-Modi-s-reforms-help-India-stocks-beat-peers-in-first-half [6/30/17]
15 – msci.com/end-of-day-data-search [6/30/17]
16 – money.cnn.com/data/commodities/ [6/30/17]
17 – inman.com/2017/06/21/consumer-resilience-boosts-may-existing-home-sales/ [6/26/17]
18 – freddiemac.com/pmms/archive.html [7/4/17]
19 – barchart.com/stocks/indices#/viewName=performance [6/30/17]
20 – barchart.com/stocks/indices#/viewName=performance [3/31/17]
21 – bigcharts.marketwatch.com/historical/default.asp?symb=DJIA&closeDate=6%2F30%2F16&x=0&y=0 [6/30/17]
21 – bigcharts.marketwatch.com/historical/default.asp?symb=COMP&closeDate=6%2F30%2F16&x=0&y=0 [6/30/17]
21 – bigcharts.marketwatch.com/historical/default.asp?symb=SPX&closeDate=6%2F30%2F16&x=0&y=0 [6/30/17]
21 – bigcharts.marketwatch.com/historical/default.asp?symb=DJIA&closeDate=6%2F29%2F07&x=0&y=0 [6/30/17]
21 – bigcharts.marketwatch.com/historical/default.asp?symb=COMP&closeDate=6%2F29%2F07&x=0&y=0 [6/30/17]
21 – bigcharts.marketwatch.com/historical/default.asp?symb=SPX&closeDate=6%2F29%2F07&x=0&y=0 [6/30/17]
22 – treasury.gov/resource-center/data-chart-center/interest-rates/Pages/TextView.aspx?data=realyieldAll [7/3/17]
23 – cnbc.com/2017/06/30/chances-for-second-half-stock-market-gains-are-good.html [6/30/17]
Other Information:
Adams Wealth Management Group LLC (“Adams Wealth Management”) is a registered investment adviser offering advisory services in the State of Texas and in other jurisdictions where exempted. Registration does not imply a certain level of skill or training. The presence of this website on the Internet shall not be directly or indirectly interpreted as a solicitation of investment advisory services to persons of another jurisdiction unless otherwise permitted by statute. Follow-up or individualized responses to consumers in a particular state by Adams Wealth Management in the rendering of personalized investment advice for compensation shall not be made without our first complying with jurisdiction requirements or pursuant an applicable state exemption.
All written content on this site is for information purposes only. Opinions expressed herein are solely those of Adams Wealth Management, unless otherwise specifically cited. Material presented is believed to be from reliable sources and no representations are made by our firm as to another parties’ informational accuracy or completeness. All information or ideas provided should be discussed in detail with an advisor, accountant or legal counsel prior to implementation.
All investing involves risk, including the potential for loss of principal. There is no guarantee that any investment strategy or plan will be successful.
