
WEEKLY QUOTE
“Imagination and fiction make up more than three quarters of our real life.”
– Simone Weil
WEEKLY TIP
If your child is going to a faraway college this fall, this is the time to investigate housing options. Keep in mind that while off-campus rents may be cheaper than the rent for a dorm unit, utilities, food, and commuting costs may offset the apparent savings.
WEEKLY RIDDLE
Kelsey is 16, and she just learned how to drive. She was on the other side of the road yesterday morning, but did not get a ticket even though a police car saw her. Why?
Last week’s riddle
They come at night without being called. They are lost in the day without being stolen. What are they?
Last week’s answer:
Stars.
HOME SALES DECLINE
Both new and existing home sales weakened in April, according to reports from the Census Bureau and National Association of Realtors. Resales were down 2.5%; new home buying, 1.5%. NAR chief economist Lawrence Yun cited “the utter lack of available listings on the market” as the “root cause” of the retreat in resales. Existing home sales were down 1.4% year-over-year through April; on the other hand, the pace of new home buying improved 8.4% in the same 12 months. Zillow says that existing home values soared 8.7% in the year ending in April; that is the largest annualized jump it has recorded since June 2006.(1,2)
CONSUMER SENTIMENT TURNS SLIGHTLY LOWER
The University of Michigan’s preliminary May consumer sentiment index came in at 98.0 on Friday, 0.8 points below its final April reading. The gauge was 0.9 points above its year-ago level.(3)
OIL TAKES A FALL
WTI crude suffered a 4.9% loss last week on the NYMEX. The price settled at $67.88 Friday after a 4.2% single-day dive. That was the lowest close since May 1. The main reason for the drop? News that OPEC countries and Russia may boost output to counter production slumps in Iran and Venezuela.(4)
A POSITIVE FIVE DAYS FOR STOCKS
All three major Wall Street equity indices advanced last week. Leading the way, the Nasdaq Composite improved 1.08% to 7,433.85. The S&P 500 added 0.31% to settle at 2,721.33 Friday; the Dow Industrials gained 0.15% to reach 24,753.09.(5)
THIS WEEK: U.S. financial markets are closed Monday in observance of Memorial Day. The Conference Board’s May consumer confidence index arrives on Tuesday, along with the latest S&P CoreLogic Case-Shiller home price index and Q1 results from Booz Allen Hamilton, HP, and Salesforce. Wednesday offers the May ADP payrolls report, a second estimate of Q1 GDP, a new Federal Reserve Beige Book, and earnings from Analog Devices, Bank of Montreal, Chico’s FAS, Dick’s Sporting Goods, DSW, Guess, and Michael Kors. April personal spending and pending home sales numbers surface Thursday, in addition to a new initial claims report and earnings from American Eagle Outfitters, Costco, Dollar General, Dollar Tree, Express, Kirkland’s, Lululemon Athletica, and Ulta Beauty. The April jobs report from the Department of Labor appears Friday, plus the May ISM manufacturing PMI and quarterly results from Abercrombie & Fitch.
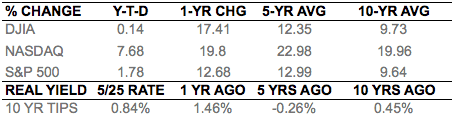
Indices are unmanaged, do not incur fees or expenses, and cannot be invested into directly. These returns do not include dividends. 10-year TIPS real yield = projected return at maturity given expected inflation.
This material was prepared by MarketingPro, Inc., and does not necessarily represent the views of the presenting party, nor their affiliates. The information herein has been derived from sources believed to be accurate. Please note – investing involves risk, and past performance is no guarantee of future results. Investments will fluctuate and when redeemed may be worth more or less than when originally invested. This information should not be construed as investment, tax or legal advice and may not be relied on for the purpose of avoiding any Federal tax penalty. This is neither a solicitation nor recommendation to purchase or sell any investment or insurance product or service, and should not be relied upon as such. All market indices discussed are unmanaged and are not illustrative of any particular investment. Indices do not incur management fees, costs and expenses, and cannot be invested into directly. All economic and performance data is historical and not indicative of future results. The Dow Jones Industrial Average is a price-weighted index of 30 actively traded blue-chip stocks. The NASDAQ Composite Index is a market-weighted index of all over-the-counter common stocks traded on the National Association of Securities Dealers Automated Quotation System. The Standard & Poor’s 500 (S&P 500) is a market-cap weighted index composed of the common stocks of 500 leading companies in leading industries of the U.S. economy. NYSE Group, Inc. (NYSE:NYX) operates two securities exchanges: the New York Stock Exchange (the “NYSE”) and NYSE Arca (formerly known as the Archipelago Exchange, or ArcaEx®, and the Pacific Exchange). NYSE Group is a leading provider of securities listing, trading and market data products and services. The New York Mercantile Exchange, Inc. (NYMEX) is the world’s largest physical commodity futures exchange and the preeminent trading forum for energy and precious metals, with trading conducted through two divisions – the NYMEX Division, home to the energy, platinum, and palladium markets, and the COMEX Division, on which all other metals trade. Additional risks are associated with international investing, such as currency fluctuations, political and economic instability and differences in accounting standards. This material represents an assessment of the market environment at a specific point in time and is not intended to be a forecast of future events, or a guarantee of future results. MarketingPro, Inc. is not affiliated with any person or firm that may be providing this information to you. The publisher is not engaged in rendering legal, accounting or other professional services. If assistance is needed, the reader is advised to engage the services of a competent professional.
Citations.
1 – investopedia.com/news/home-values-jumped-87-april-0/ [5/25/18]
2 – tinyurl.com/y86fcsr3 [5/23/18]
3 – sca.isr.umich.edu/ [5/25/18]
4 – marketwatch.com/story/oil-prices-slide-as-opec-russia-mull-output-increase-2018-05-25 [5/25/18]
5 – markets.wsj.com/us [5/25/18]
6 – bigcharts.marketwatch.com/historical/default.asp?symb=DJIA&closeDate=5%2F25%2F17&x=0&y=0 [5/25/18]
6 – bigcharts.marketwatch.com/historical/default.asp?symb=COMP&closeDate=5%2F25%2F17&x=0&y=0 [5/25/18]
6 – bigcharts.marketwatch.com/historical/default.asp?symb=SPX&closeDate=5%2F25%2F17&x=0&y=0 [5/25/18]
6 – bigcharts.marketwatch.com/historical/default.asp?symb=DJIA&closeDate=5%2F24%2F13&x=0&y=0 [5/25/18]
6 – bigcharts.marketwatch.com/historical/default.asp?symb=COMP&closeDate=5%2F24%2F13&x=0&y=0 [5/25/18]
6 – bigcharts.marketwatch.com/historical/default.asp?symb=SPX&closeDate=5%2F24%2F13&x=0&y=0 [5/25/18]
6 – bigcharts.marketwatch.com/historical/default.asp?symb=DJIA&closeDate=5%2F27%2F08&x=0&y=0 [5/25/18]
6 – bigcharts.marketwatch.com/historical/default.asp?symb=COMP&closeDate=5%2F27%2F08&x=0&y=0 [5/25/18]
6 – bigcharts.marketwatch.com/historical/default.asp?symb=SPX&closeDate=5%2F27%2F08&x=0&y=0 [5/25/18]
7 – treasury.gov/resource-center/data-chart-center/interest-rates/Pages/TextView.aspx?data=realyield [5/25/18]
8 – treasury.gov/resource-center/data-chart-center/interest-rates/Pages/TextView.aspx?data=realyieldAll [5/25/18]
HOME SALES DECLINE
Both new and existing home sales weakened in April, according to reports from the Census Bureau and National Association of Realtors. Resales were down 2.5%; new home buying, 1.5%. NAR chief economist Lawrence Yun cited “the utter lack of available listings on the market” as the “root cause” of the retreat in resales. Existing home sales were down 1.4% year-over-year through April; on the other hand, the pace of new home buying improved 8.4% in the same 12 months. Zillow says that existing home values soared 8.7% in the year ending in April; that is the largest annualized jump it has recorded since June 2006.(1,2)
CONSUMER SENTIMENT TURNS SLIGHTLY LOWER
The University of Michigan’s preliminary May consumer sentiment index came in at 98.0 on Friday, 0.8 points below its final April reading. The gauge was 0.9 points above its year-ago level.(3)
OIL TAKES A FALL
WTI crude suffered a 4.9% loss last week on the NYMEX. The price settled at $67.88 Friday after a 4.2% single-day dive. That was the lowest close since May 1. The main reason for the drop? News that OPEC countries and Russia may boost output to counter production slumps in Iran and Venezuela.(4)
A POSITIVE FIVE DAYS FOR STOCKS
All three major Wall Street equity indices advanced last week. Leading the way, the Nasdaq Composite improved 1.08% to 7,433.85. The S&P 500 added 0.31% to settle at 2,721.33 Friday; the Dow Industrials gained 0.15% to reach 24,753.09.(5)
THIS WEEK: U.S. financial markets are closed Monday in observance of Memorial Day. The Conference Board’s May consumer confidence index arrives on Tuesday, along with the latest S&P CoreLogic Case-Shiller home price index and Q1 results from Booz Allen Hamilton, HP, and Salesforce. Wednesday offers the May ADP payrolls report, a second estimate of Q1 GDP, a new Federal Reserve Beige Book, and earnings from Analog Devices, Bank of Montreal, Chico’s FAS, Dick’s Sporting Goods, DSW, Guess, and Michael Kors. April personal spending and pending home sales numbers surface Thursday, in addition to a new initial claims report and earnings from American Eagle Outfitters, Costco, Dollar General, Dollar Tree, Express, Kirkland’s, Lululemon Athletica, and Ulta Beauty. The April jobs report from the Department of Labor appears Friday, plus the May ISM manufacturing PMI and quarterly results from Abercrombie & Fitch.
Indices are unmanaged, do not incur fees or expenses, and cannot be invested into directly. These returns do not include dividends. 10-year TIPS real yield = projected return at maturity given expected inflation.
This material was prepared by MarketingPro, Inc., and does not necessarily represent the views of the presenting party, nor their affiliates. The information herein has been derived from sources believed to be accurate. Please note – investing involves risk, and past performance is no guarantee of future results. Investments will fluctuate and when redeemed may be worth more or less than when originally invested. This information should not be construed as investment, tax or legal advice and may not be relied on for the purpose of avoiding any Federal tax penalty. This is neither a solicitation nor recommendation to purchase or sell any investment or insurance product or service, and should not be relied upon as such. All market indices discussed are unmanaged and are not illustrative of any particular investment. Indices do not incur management fees, costs and expenses, and cannot be invested into directly. All economic and performance data is historical and not indicative of future results. The Dow Jones Industrial Average is a price-weighted index of 30 actively traded blue-chip stocks. The NASDAQ Composite Index is a market-weighted index of all over-the-counter common stocks traded on the National Association of Securities Dealers Automated Quotation System. The Standard & Poor’s 500 (S&P 500) is a market-cap weighted index composed of the common stocks of 500 leading companies in leading industries of the U.S. economy. NYSE Group, Inc. (NYSE:NYX) operates two securities exchanges: the New York Stock Exchange (the “NYSE”) and NYSE Arca (formerly known as the Archipelago Exchange, or ArcaEx®, and the Pacific Exchange). NYSE Group is a leading provider of securities listing, trading and market data products and services. The New York Mercantile Exchange, Inc. (NYMEX) is the world’s largest physical commodity futures exchange and the preeminent trading forum for energy and precious metals, with trading conducted through two divisions – the NYMEX Division, home to the energy, platinum, and palladium markets, and the COMEX Division, on which all other metals trade. Additional risks are associated with international investing, such as currency fluctuations, political and economic instability and differences in accounting standards. This material represents an assessment of the market environment at a specific point in time and is not intended to be a forecast of future events, or a guarantee of future results. MarketingPro, Inc. is not affiliated with any person or firm that may be providing this information to you. The publisher is not engaged in rendering legal, accounting or other professional services. If assistance is needed, the reader is advised to engage the services of a competent professional.
Citations.
1 – investopedia.com/news/home-values-jumped-87-april-0/ [5/25/18]
2 – tinyurl.com/y86fcsr3 [5/23/18]
3 – sca.isr.umich.edu/ [5/25/18]
4 – marketwatch.com/story/oil-prices-slide-as-opec-russia-mull-output-increase-2018-05-25 [5/25/18]
5 – markets.wsj.com/us [5/25/18]
6 – bigcharts.marketwatch.com/historical/default.asp?symb=DJIA&closeDate=5%2F25%2F17&x=0&y=0 [5/25/18]
6 – bigcharts.marketwatch.com/historical/default.asp?symb=COMP&closeDate=5%2F25%2F17&x=0&y=0 [5/25/18]
6 – bigcharts.marketwatch.com/historical/default.asp?symb=SPX&closeDate=5%2F25%2F17&x=0&y=0 [5/25/18]
6 – bigcharts.marketwatch.com/historical/default.asp?symb=DJIA&closeDate=5%2F24%2F13&x=0&y=0 [5/25/18]
6 – bigcharts.marketwatch.com/historical/default.asp?symb=COMP&closeDate=5%2F24%2F13&x=0&y=0 [5/25/18]
6 – bigcharts.marketwatch.com/historical/default.asp?symb=SPX&closeDate=5%2F24%2F13&x=0&y=0 [5/25/18]
6 – bigcharts.marketwatch.com/historical/default.asp?symb=DJIA&closeDate=5%2F27%2F08&x=0&y=0 [5/25/18]
6 – bigcharts.marketwatch.com/historical/default.asp?symb=COMP&closeDate=5%2F27%2F08&x=0&y=0 [5/25/18]
6 – bigcharts.marketwatch.com/historical/default.asp?symb=SPX&closeDate=5%2F27%2F08&x=0&y=0 [5/25/18]
7 – treasury.gov/resource-center/data-chart-center/interest-rates/Pages/TextView.aspx?data=realyield [5/25/18]
8 – treasury.gov/resource-center/data-chart-center/interest-rates/Pages/TextView.aspx?data=realyieldAll [5/25/18]
