
WEEKLY QUOTE
“Knowledge is love and light and vision.”
– Helen Keller
WEEKLY TIP
In retirement, arranging income distributions with an eye on tax efficiency could help your savings last longer. Smaller, tax-deferred account distributions will make your annual income taxes more bearable.
WEEKLY RIDDLE
Jon drove past the college at 60 mph, but he wasn’t pulled over or cited, even though a police officer was right behind him. Why?
Last week’s riddle
I follow you during the daytime, but at night I can’t be seen. What am I?
Last week’s answer:
Your shadow.
SUMMER SLOWDOWN HITS HOUSING MARKET
Low inventory and high prices are taking a toll on existing home sales. They declined 1.3% in July, according to the National Association of Realtors, making a second straight monthly retreat. In the past 12 months, the number of existing homes on the market has shrunk 9.0%, while the median sale price has risen 6.2% to $258,300. While resales were up 2.1% year-over-year, the seasonally adjusted annual sales rate reached a 2017 low in July. Census Bureau data showed new home sales falling 9.4% last month.(1,2)
GASOLINE FUTURES RISE, BUT OIL FUTURES FALL
On the NYMEX, unleaded gasoline gained 2.6% last week, with prices briefly reaching a 5-month peak. Even as oncoming Hurricane Harvey posed a threat to Gulf Coast oil output, crude lost 1.6% last week to settle at $47.87 Friday.(3)
More from Adams Wealth Management.
Understanding 401(k) Rollovers
ORDERS FOR DURABLES DECLINE
Hard goods orders retreated 6.8% for July; the decrease was 7.8% with defense orders factored out. However, core orders (which do not include transportation equipment purchases) were up 0.5% last month.(1)
STOCKS ADVANCE
August could end up being a down month for the S&P 500, but the index was up for the week. It rose 0.72% in five days to 2,443.05. The Dow and Nasdaq also advanced last week: the blue chips added 0.64% to close at 21,813.67 Friday, and Wall Street’s top tech benchmark gained 0.79% to 6,265.64.(4)
THIS WEEK: Nothing major is slated for Monday. Tuesday, the latest Conference Board consumer confidence index appears, along with the June S&P/Case-Shiller home price index and earnings from Bank of Montreal, Best Buy, and H&R Block. On Wednesday, Wall Street scrutinizes ADP’s August payroll report, the second estimate of Q2 GDP, and earnings news from Analog Devices, Bob Evans Farms, Chico’s FAS, Five Below, and Shoe Carnival. Thursday sees the release of July personal spending data, the Federal Reserve’s July PCE price index, the August Challenger job-cut report, the NAR’s July pending home sales index, new initial claims numbers, and earnings from Campbell Soup, Dollar General, Land’s End, and Lululemon Athletica. The Department of Labor’s August jobs report, the final August University of Michigan consumer sentiment index, and the August ISM factory PMI all arrive on Friday.
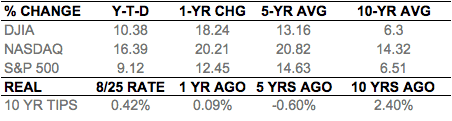
Indices are unmanaged, do not incur fees or expenses, and cannot be invested into directly. These returns do not include dividends. 10-year TIPS real yield = projected return at maturity given expected inflation.
However you see your tomorrow, the best time to plan for it is today.
This material was prepared by MarketingPro, Inc., and does not necessarily represent the views of the presenting party, nor their affiliates. The information herein has been derived from sources believed to be accurate. Please note – investing involves risk, and past performance is no guarantee of future results. Investments will fluctuate and when redeemed may be worth more or less than when originally invested. This information should not be construed as investment, tax or legal advice and may not be relied on for the purpose of avoiding any Federal tax penalty. This is neither a solicitation nor recommendation to purchase or sell any investment or insurance product or service, and should not be relied upon as such. All market indices discussed are unmanaged and are not illustrative of any particular investment. Indices do not incur management fees, costs and expenses, and cannot be invested into directly. All economic and performance data is historical and not indicative of future results. The Dow Jones Industrial Average is a price-weighted index of 30 actively traded blue-chip stocks. The NASDAQ Composite Index is a market-weighted index of all over-the-counter common stocks traded on the National Association of Securities Dealers Automated Quotation System. The Standard & Poor’s 500 (S&P 500) is a market-cap weighted index composed of the common stocks of 500 leading companies in leading industries of the U.S. economy. NYSE Group, Inc. (NYSE:NYX) operates two securities exchanges: the New York Stock Exchange (the “NYSE”) and NYSE Arca (formerly known as the Archipelago Exchange, or ArcaEx®, and the Pacific Exchange). NYSE Group is a leading provider of securities listing, trading and market data products and services. The New York Mercantile Exchange, Inc. (NYMEX) is the world’s largest physical commodity futures exchange and the preeminent trading forum for energy and precious metals, with trading conducted through two divisions – the NYMEX Division, home to the energy, platinum, and palladium markets, and the COMEX Division, on which all other metals trade. Additional risks are associated with international investing, such as currency fluctuations, political and economic instability and differences in accounting standards. This material represents an assessment of the market environment at a specific point in time and is not intended to be a forecast of future events, or a guarantee of future results. MarketingPro, Inc. is not affiliated with any person or firm that may be providing this information to you. The publisher is not engaged in rendering legal, accounting or other professional services. If assistance is needed, the reader is advised to engage the services of a competent professional.
Citations.
1 – investing.com/economic-calendar/ [8/25/17]
2 – inman.com/2017/08/24/existing-home-sales-dip-for-second-month-in-a-row/ [8/24/17]
3 – marketwatch.com/story/gasoline-ends-barely-higher-after-touching-a-5-month-high-2017-08-25 [8/25/17]
4 – markets.wsj.com/us [8/25/17]
5 – bigcharts.marketwatch.com/historical/default.asp?symb=DJIA&closeDate=8%2F25%2F16&x=0&y=0 [8/25/17]
5 – bigcharts.marketwatch.com/historical/default.asp?symb=COMP&closeDate=8%2F25%2F16&x=0&y=0 [8/25/17]
5 – bigcharts.marketwatch.com/historical/default.asp?symb=SPX&closeDate=8%2F25%2F16&x=0&y=0 [8/25/17]
5 – bigcharts.marketwatch.com/historical/default.asp?symb=DJIA&closeDate=8%2F24%2F12&x=0&y=0 [8/25/17]
5 – bigcharts.marketwatch.com/historical/default.asp?symb=COMP&closeDate=8%2F24%2F12&x=0&y=0 [8/25/17]
5 – bigcharts.marketwatch.com/historical/default.asp?symb=SPX&closeDate=8%2F24%2F12&x=0&y=0 [8/25/17]
5 – bigcharts.marketwatch.com/historical/default.asp?symb=DJIA&closeDate=8%2F24%2F07&x=0&y=0 [8/25/17]
5 – bigcharts.marketwatch.com/historical/default.asp?symb=COMP&closeDate=8%2F24%2F07&x=0&y=0 [8/25/17]
5 – bigcharts.marketwatch.com/historical/default.asp?symb=SPX&closeDate=8%2F24%2F07&x=0&y=0 [8/25/17]
6 – treasury.gov/resource-center/data-chart-center/interest-rates/Pages/TextView.aspx?data=realyield [8/25/17]
7 – treasury.gov/resource-center/data-chart-center/interest-rates/Pages/TextView.aspx?data=realyieldAll [8/25/17]
SUMMER SLOWDOWN HITS HOUSING MARKET
Low inventory and high prices are taking a toll on existing home sales. They declined 1.3% in July, according to the National Association of Realtors, making a second straight monthly retreat. In the past 12 months, the number of existing homes on the market has shrunk 9.0%, while the median sale price has risen 6.2% to $258,300. While resales were up 2.1% year-over-year, the seasonally adjusted annual sales rate reached a 2017 low in July. Census Bureau data showed new home sales falling 9.4% last month.(1,2)
GASOLINE FUTURES RISE, BUT OIL FUTURES FALL
On the NYMEX, unleaded gasoline gained 2.6% last week, with prices briefly reaching a 5-month peak. Even as oncoming Hurricane Harvey posed a threat to Gulf Coast oil output, crude lost 1.6% last week to settle at $47.87 Friday.(3)
More from Adams Wealth Management.
Understanding 401(k) Rollovers
ORDERS FOR DURABLES DECLINE
Hard goods orders retreated 6.8% for July; the decrease was 7.8% with defense orders factored out. However, core orders (which do not include transportation equipment purchases) were up 0.5% last month.(1)
STOCKS ADVANCE
August could end up being a down month for the S&P 500, but the index was up for the week. It rose 0.72% in five days to 2,443.05. The Dow and Nasdaq also advanced last week: the blue chips added 0.64% to close at 21,813.67 Friday, and Wall Street’s top tech benchmark gained 0.79% to 6,265.64.(4)
THIS WEEK: Nothing major is slated for Monday. Tuesday, the latest Conference Board consumer confidence index appears, along with the June S&P/Case-Shiller home price index and earnings from Bank of Montreal, Best Buy, and H&R Block. On Wednesday, Wall Street scrutinizes ADP’s August payroll report, the second estimate of Q2 GDP, and earnings news from Analog Devices, Bob Evans Farms, Chico’s FAS, Five Below, and Shoe Carnival. Thursday sees the release of July personal spending data, the Federal Reserve’s July PCE price index, the August Challenger job-cut report, the NAR’s July pending home sales index, new initial claims numbers, and earnings from Campbell Soup, Dollar General, Land’s End, and Lululemon Athletica. The Department of Labor’s August jobs report, the final August University of Michigan consumer sentiment index, and the August ISM factory PMI all arrive on Friday.
Indices are unmanaged, do not incur fees or expenses, and cannot be invested into directly. These returns do not include dividends. 10-year TIPS real yield = projected return at maturity given expected inflation.
However you see your tomorrow, the best time to plan for it is today.
This material was prepared by MarketingPro, Inc., and does not necessarily represent the views of the presenting party, nor their affiliates. The information herein has been derived from sources believed to be accurate. Please note – investing involves risk, and past performance is no guarantee of future results. Investments will fluctuate and when redeemed may be worth more or less than when originally invested. This information should not be construed as investment, tax or legal advice and may not be relied on for the purpose of avoiding any Federal tax penalty. This is neither a solicitation nor recommendation to purchase or sell any investment or insurance product or service, and should not be relied upon as such. All market indices discussed are unmanaged and are not illustrative of any particular investment. Indices do not incur management fees, costs and expenses, and cannot be invested into directly. All economic and performance data is historical and not indicative of future results. The Dow Jones Industrial Average is a price-weighted index of 30 actively traded blue-chip stocks. The NASDAQ Composite Index is a market-weighted index of all over-the-counter common stocks traded on the National Association of Securities Dealers Automated Quotation System. The Standard & Poor’s 500 (S&P 500) is a market-cap weighted index composed of the common stocks of 500 leading companies in leading industries of the U.S. economy. NYSE Group, Inc. (NYSE:NYX) operates two securities exchanges: the New York Stock Exchange (the “NYSE”) and NYSE Arca (formerly known as the Archipelago Exchange, or ArcaEx®, and the Pacific Exchange). NYSE Group is a leading provider of securities listing, trading and market data products and services. The New York Mercantile Exchange, Inc. (NYMEX) is the world’s largest physical commodity futures exchange and the preeminent trading forum for energy and precious metals, with trading conducted through two divisions – the NYMEX Division, home to the energy, platinum, and palladium markets, and the COMEX Division, on which all other metals trade. Additional risks are associated with international investing, such as currency fluctuations, political and economic instability and differences in accounting standards. This material represents an assessment of the market environment at a specific point in time and is not intended to be a forecast of future events, or a guarantee of future results. MarketingPro, Inc. is not affiliated with any person or firm that may be providing this information to you. The publisher is not engaged in rendering legal, accounting or other professional services. If assistance is needed, the reader is advised to engage the services of a competent professional.
Citations.
1 – investing.com/economic-calendar/ [8/25/17]
2 – inman.com/2017/08/24/existing-home-sales-dip-for-second-month-in-a-row/ [8/24/17]
3 – marketwatch.com/story/gasoline-ends-barely-higher-after-touching-a-5-month-high-2017-08-25 [8/25/17]
4 – markets.wsj.com/us [8/25/17]
5 – bigcharts.marketwatch.com/historical/default.asp?symb=DJIA&closeDate=8%2F25%2F16&x=0&y=0 [8/25/17]
5 – bigcharts.marketwatch.com/historical/default.asp?symb=COMP&closeDate=8%2F25%2F16&x=0&y=0 [8/25/17]
5 – bigcharts.marketwatch.com/historical/default.asp?symb=SPX&closeDate=8%2F25%2F16&x=0&y=0 [8/25/17]
5 – bigcharts.marketwatch.com/historical/default.asp?symb=DJIA&closeDate=8%2F24%2F12&x=0&y=0 [8/25/17]
5 – bigcharts.marketwatch.com/historical/default.asp?symb=COMP&closeDate=8%2F24%2F12&x=0&y=0 [8/25/17]
5 – bigcharts.marketwatch.com/historical/default.asp?symb=SPX&closeDate=8%2F24%2F12&x=0&y=0 [8/25/17]
5 – bigcharts.marketwatch.com/historical/default.asp?symb=DJIA&closeDate=8%2F24%2F07&x=0&y=0 [8/25/17]
5 – bigcharts.marketwatch.com/historical/default.asp?symb=COMP&closeDate=8%2F24%2F07&x=0&y=0 [8/25/17]
5 – bigcharts.marketwatch.com/historical/default.asp?symb=SPX&closeDate=8%2F24%2F07&x=0&y=0 [8/25/17]
6 – treasury.gov/resource-center/data-chart-center/interest-rates/Pages/TextView.aspx?data=realyield [8/25/17]
7 – treasury.gov/resource-center/data-chart-center/interest-rates/Pages/TextView.aspx?data=realyieldAll [8/25/17]
