
Investment Objective
Growth
By The Numbers
Month-To-Date: 2.60%
Quarter-To-Date: 2.60%
Year-To-Date: 7.24%
1 Year: 17.23%
Since Inception (Annualized): 20.31%
Inception: 01/04/2017
All data for this report is as of 07/31/2018
The Equity Trend Model Portfolio
About the model: Adams Wealth Management’s Equity Trend Model is a quantitative, trend-following model portfolio that invests in up to 25 individual equities. Our rules-driven model takes a risk-on/risk-off approach to investing focusing on stocks that are appreciating in price as the broader market trends higher. When the broader market is trending lower, the model will invest in fixed-income ETFs (exchange-traded funds) or a basket of fixed-income ETFs. The investment objective of this model is growth and may not be suitable for all investors. For purposes of comparison, this report uses the S&P 500 Total Return Index. For more information about this model, please read our disclosures.
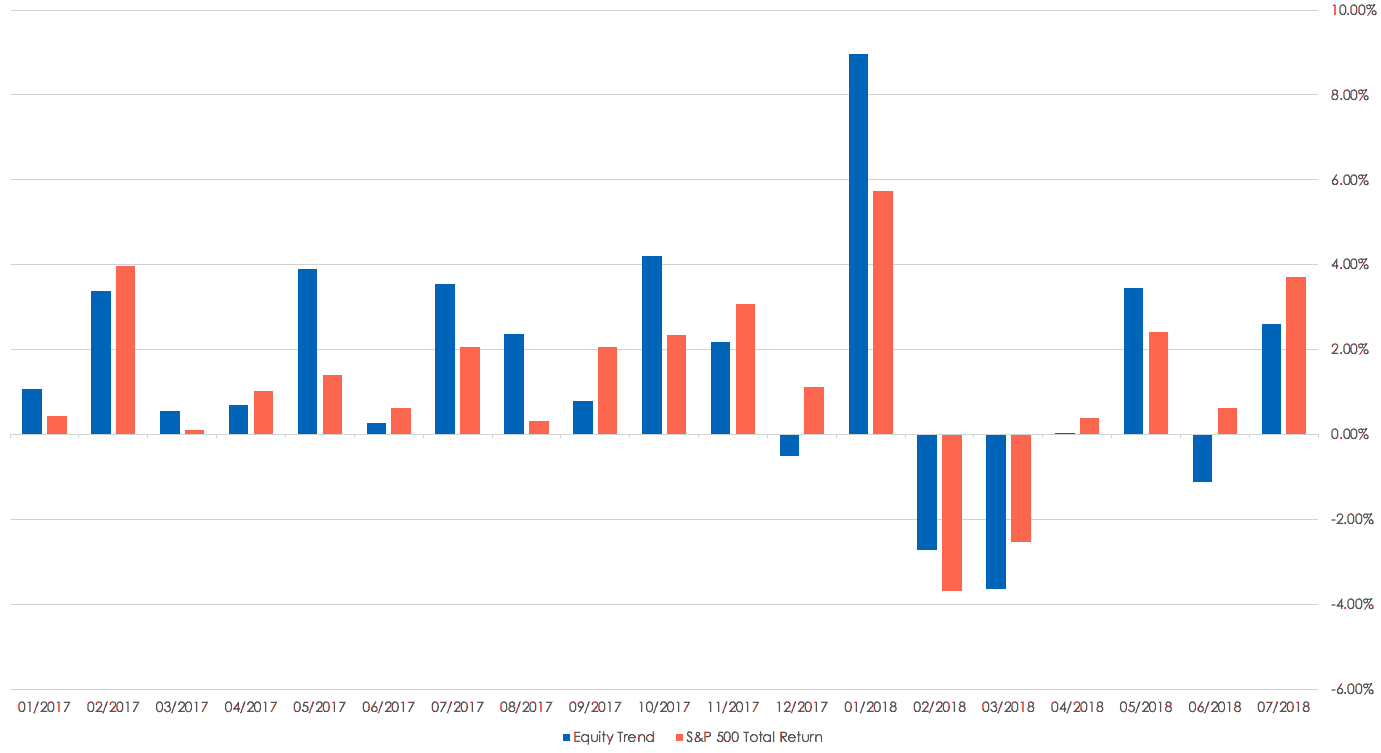
The month in review: The Equity Trend Model posted a return of 2.60% in July. Despite the solid return, the Equity Trend Model underperformed the S&P 500 Total Return Index which posted a return of 3.40% for the month. The underperformance was largely as a result of the decline in Netflix (NFLX), one of the model’s top performing positions since inception. Only four positions in the model posted negative returns for the month: Netflix (NFLX): -13.79%, Constellation Brands Inc: (STZ): -3.95%, Accenture PLC (ACN): -2.60%, and Northrop Grumman Corp (NOC): -2.34%. The remaining positions posted positive returns for the month with double digit returns from the top three performers: JPMorgan Chase & Co. (JPM): 10.85%, Honeywell International Inc.(HON): 10.83%, and CSX Corp (CSX): 10.82%.
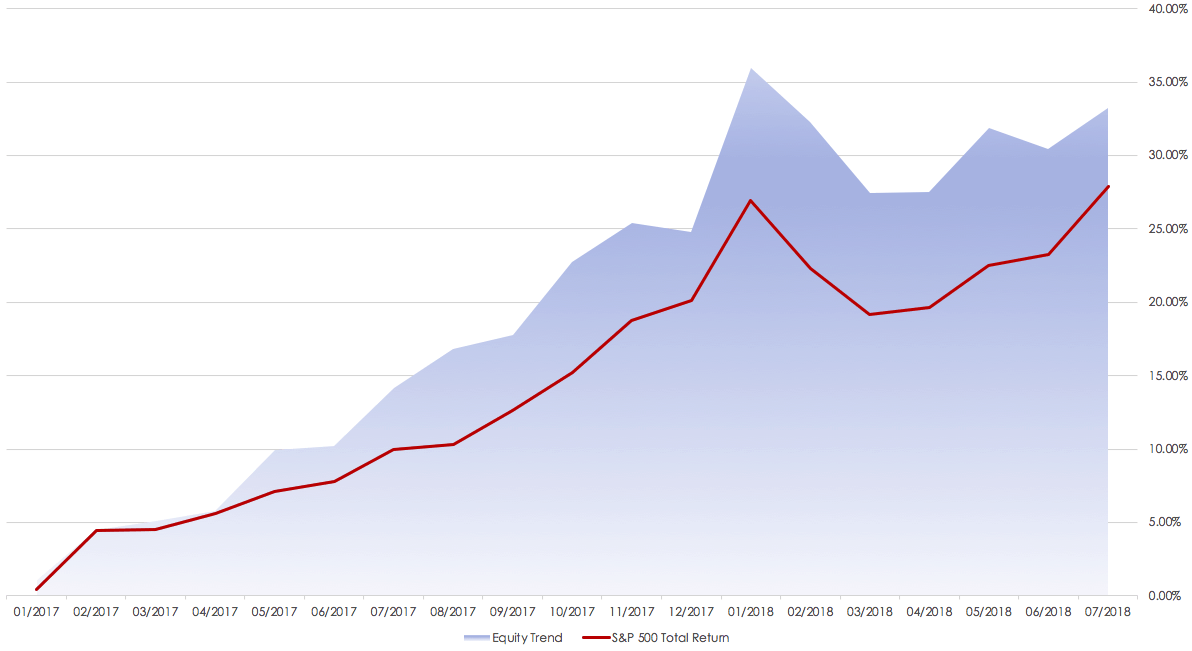
Although the Equity Trend Model’s performance lagged in the month of July, the model has still outpaced the S&P 500 Total Return Index by 5.95% since inception. The cumulative return for the Equity Trend Model is 33.81% vs. the S&P 500 Total Return of 27.86% as of the end of July 2018.
Cumulative Return Since Inception
Return by Month
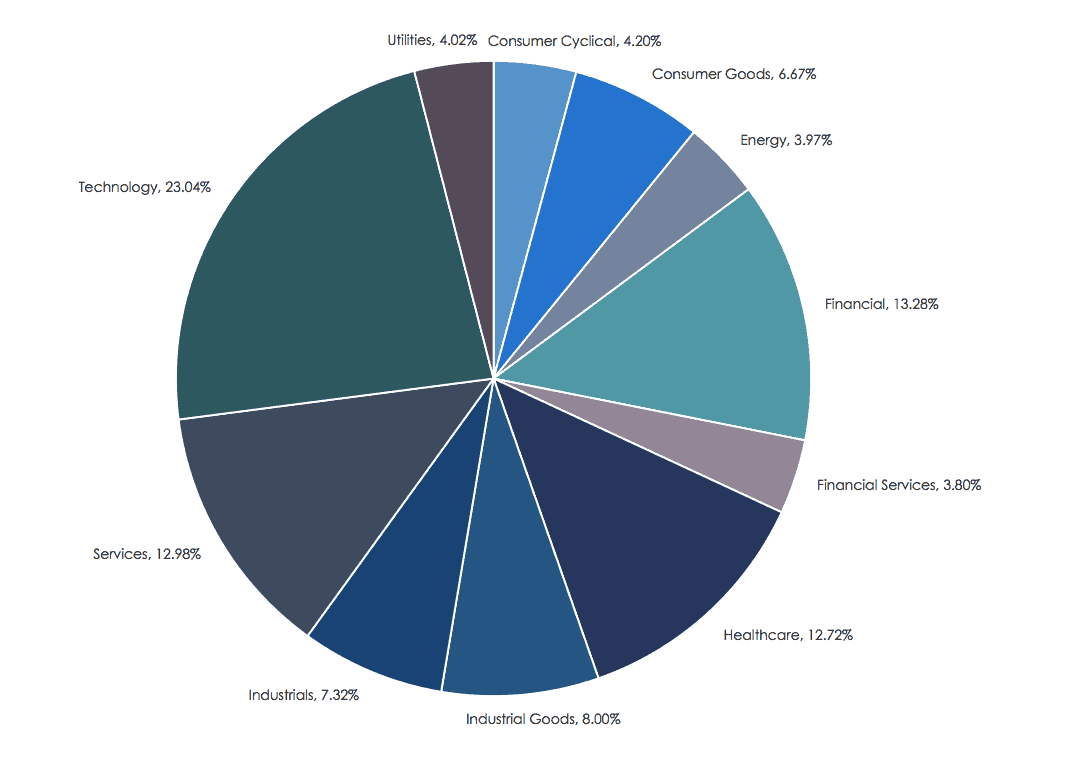
Sector Allocation
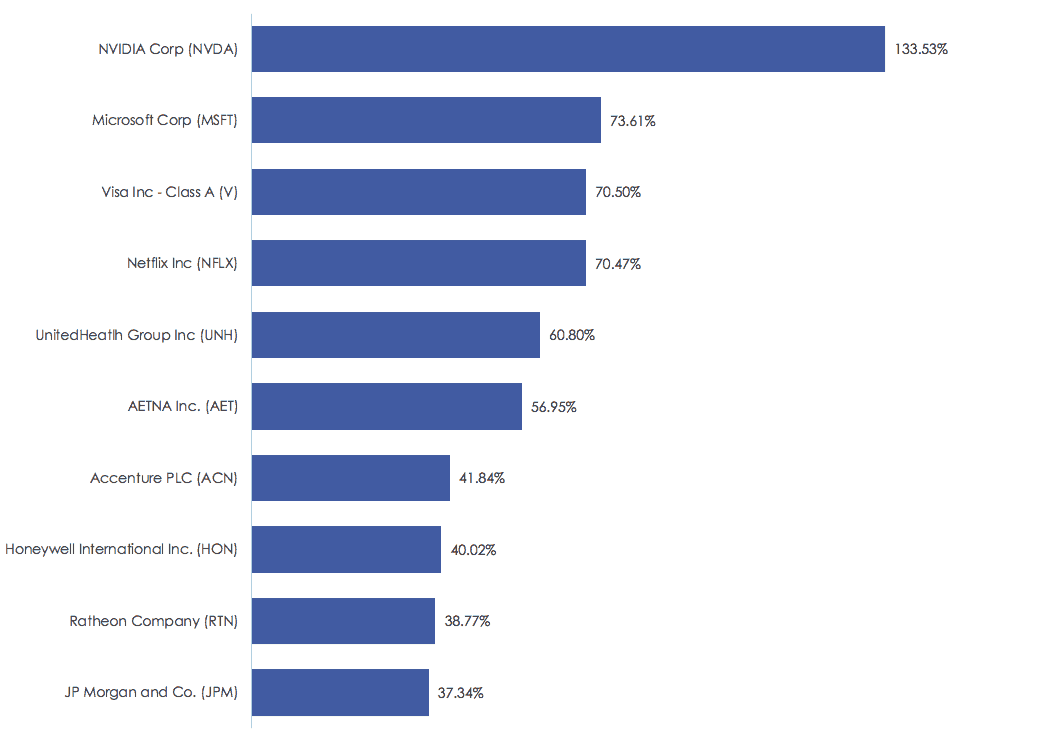
Top 10 Current Holdings by Cumulative Return
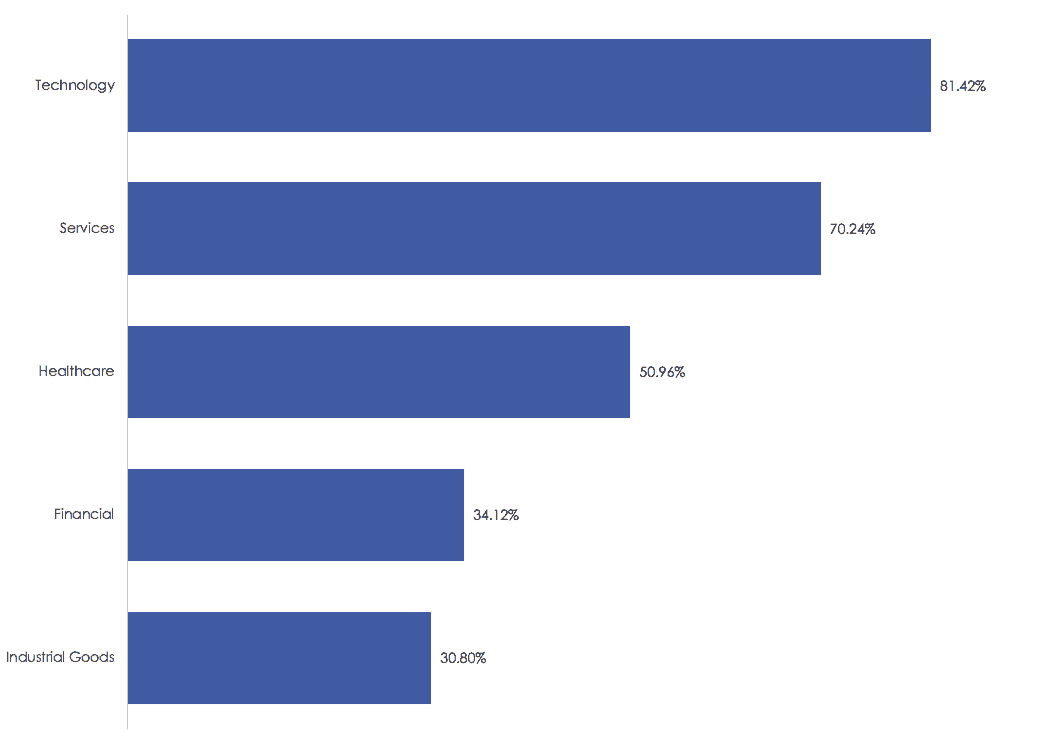
Top 5 Current Sectors by Cumulative Return
Disclosures
This information provided is an investment model and does not reflect actual client(s) performance. This model may not be suitable for all investors. Adams Wealth Management seeks to provide investments suitable for all of our clients. As a result, many if not all of our clients will own varying allocations to this and/or other models. Clients with different objects have different results portrayed from this model.
The information provided is net of fees(1.5%). In addition, the results of this model reflect divided payments and other income from investments made.
The Standard & Poor’s 500 Total Return Index (S&P 500 Total Return) measures the total return including distributions of the Standard and Poor’s 500 Index (S&P 500). The S&P 500 is an unmanaged, market capitalization weighted index of 500 widely held stocks. The index is composed of 500 constituent companies and is often used as a benchmark for the U.S. stock market. Please note that investors cannot directly invest in an index.
All investing involves risk, including the potential for loss of principal. There is no guarantee this model will be successful.
The Equity Trend Model Portfolio
About the model: Adams Wealth Management’s Equity Trend Model is a quantitative, trend-following model portfolio that invests in up to 25 individual equities. Our rules-driven model takes a risk-on/risk-off approach to investing focusing on stocks that are appreciating in price as the broader market trends higher. When the broader market is trending lower, the model will invest in fixed-income ETFs (exchange-traded funds) or a basket of fixed-income ETFs. The investment objective of this model is growth and may not be suitable for all investors. For purposes of comparison, this report uses the S&P 500 Total Return Index. For more information about this model, please read our disclosures.
The month in review: The Equity Trend Model posted a return of 2.60% in July. Despite the solid return, the Equity Trend Model underperformed the S&P 500 Total Return Index which posted a return of 3.40% for the month. The underperformance was largely as a result of the decline in Netflix (NFLX), one of the model’s top performing positions since inception. Only four positions in the model posted negative returns for the month: Netflix (NFLX): -13.79%, Constellation Brands Inc: (STZ): -3.95%, Accenture PLC (ACN): -2.60%, and Northrop Grumman Corp (NOC): -2.34%. The remaining positions posted positive returns for the month with double digit returns from the top three performers: JPMorgan Chase & Co. (JPM): 10.85%, Honeywell International Inc.(HON): 10.83%, and CSX Corp (CSX): 10.82%.
Although the Equity Trend Model’s performance lagged in the month of July, the model has still outpaced the S&P 500 Total Return Index by 5.95% since inception. The cumulative return for the Equity Trend Model is 33.81% vs. the S&P 500 Total Return of 27.86% as of the end of July 2018.
Investment Objective
Growth
By The Numbers
Month-To-Date: 2.60%
Quarter-To-Date: 2.60%
Year-To-Date: 7.24%
1 Year: 17.23%
Since Inception (Annualized): 20.31%
Inception: 01/04/2017
All data for this report is as of 07/31/2018
Cumulative Return Since Inception
Return by Month
Sector Allocation
Top 10 Current Holdings by Cumulative Return
Top 5 Current Sectors by Cumulative Return
Disclosures
This information provided is an investment model and does not reflect actual client(s) performance. This model may not be suitable for all investors. Adams Wealth Management seeks to provide investments suitable for all of our clients. As a result, many if not all of our clients will own varying allocations to this and/or other models. Clients with different objects have different results portrayed from this model.
The information provided is net of fees (1.5%). In addition, the results of this model reflect divided payments and other income from investments made.
The Standard & Poor’s 500 Total Return Index (S&P 500 Total Return) measures the total return including distributions of the Standard and Poor’s 500 Index (S&P 500). The S&P 500 is an unmanaged, market capitalization weighted index of 500 widely held stocks. The index is composed of 500 constituent companies and is often used as a benchmark for the U.S. stock market. Please note that investors cannot directly invest in an index.
All investing involves risk, including the potential for loss of principal. There is no guarantee this model will be successful.
