
WEEKLY QUOTE
“Do not accustom yourself to use big words for little matters.”
-SAMUEL JOHNSON
WEEKLY TIP
This year, the Internal Revenue Service eased the “use it or lose it” rule on Flexible Spending Accounts (FSAs). In the past, funds you directed into an FSA had to be spent by the end of a year or else they would be forfeited. The I.R.S. now permits you to carry over as much as $500 in FSA funds into the next year, but your employer must elect to allow this option.
WEEKLY RIDDLE
A cargo truck hauling a load of lumber can carry 2 tons. It approaches a bridge with a sign, which notes that the bridge can support up to 2 tons of weight. The driver sees the sign and reckons that the bridge should hold up under the weight of the truck. Is the driver right?
Last week’s riddle
Gary drops an egg onto a sidewalk. The egg doesn’t break after falling 3 feet. Why?
Last week’s answer:
The egg is dropped from a height of more than 3’, so after 3’ of falling, it has not yet broken.
INFLATION AT 2.9%, CORE INFLATION AT 2.4%
Friday, the Department of Labor reported these annualized gains through July of this year for the Consumer Price Index. Both the headline and core CPIs rose 0.2% last month, matching the consensus forecast of economists polled by Reuters. The yearly core inflation increase is the largest on record since September 2008. (The core inflation reading leaves out food and energy costs.) The Producer Price Index was flat in July, with the yearly advance declining slightly to 3.4%; the core PPI rose 0.3%, resulting in a 2.8% annualized gain.(1,2)
HOW IS EARNINGS SEASON GOING?
Ninety-one percent of S&P 500 companies have reported Q2 results so far. FactSet, the respected stock market analytics firm, reports that 72% have surprised to the upside in terms of sales and 79% have topped earnings expectations. Weighing actual earnings results and future projections, FactSet estimates a 24.6% “blended” earnings growth rate for the second quarter. On Friday, the forward 12-month P/E ratio for the S&P 500 was 16.6; that compares to an average of 16.2 across the past five years.(3)
OIL FALLS FOR A SIXTH STRAIGHT WEEK
WTI crude last suffered such a losing streak in 2015. Friday, it settled at $67.63 on the NYMEX, even after a 1.2% advance during Friday’s trading session. Some commodities investors believe that the emerging trade war will reduce demand for energy products.(4)
NASDAQ ADVANCES, S&P AND DOW RETREAT
The possibility of the U.S. doubling tariffs on Turkish aluminum and steel sent stocks skidding worldwide, Friday, as diplomatic disagreements between the countries took on an economic aspect. Of the three major Wall Street indices, only the Nasdaq Composite posted a weekly gain, rising 0.35% to 7,839.11. The S&P 500 fell 0.25% in five days, settling at 2,833.28 Friday. The Dow Jones Industrial Average ended the week 0.59% lower at 25,313.14.(5,6)
THIS WEEK: Sysco announces Q2 results Monday. | Advance Auto Parts, Agilent Technologies, and Home Depot present earnings on Tuesday. | On Wednesday, July retail sales numbers are out, along with earnings from Briggs & Stratton and Cisco. | Nordstrom, Nvidia, and Walmart share quarterly results on Thursday, as Wall Street also considers new data on initial jobless claims and July homebuilding activity. | The University of Michigan’s initial August consumer sentiment index appears on Friday, plus the Conference Board’s latest leading indicators index and earnings from Deere & Co.
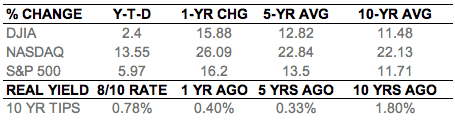
Indices are unmanaged, do not incur fees or expenses, and cannot be invested into directly. These returns do not include dividends. 10-year TIPS real yield = projected return at maturity given expected inflation.
This material was prepared by MarketingPro, Inc., and does not necessarily represent the views of the presenting party, nor their affiliates. The information herein has been derived from sources believed to be accurate. Please note – investing involves risk, and past performance is no guarantee of future results. Investments will fluctuate and when redeemed may be worth more or less than when originally invested. This information should not be construed as investment, tax or legal advice and may not be relied on for the purpose of avoiding any Federal tax penalty. This is neither a solicitation nor recommendation to purchase or sell any investment or insurance product or service, and should not be relied upon as such. All market indices discussed are unmanaged and are not illustrative of any particular investment. Indices do not incur management fees, costs and expenses, and cannot be invested into directly. All economic and performance data is historical and not indicative of future results. The Dow Jones Industrial Average is a price-weighted index of 30 actively traded blue-chip stocks. The NASDAQ Composite Index is a market-weighted index of all over-the-counter common stocks traded on the National Association of Securities Dealers Automated Quotation System. The Standard & Poor’s 500 (S&P 500) is a market-cap weighted index composed of the common stocks of 500 leading companies in leading industries of the U.S. economy. NYSE Group, Inc. (NYSE:NYX) operates two securities exchanges: the New York Stock Exchange (the “NYSE”) and NYSE Arca (formerly known as the Archipelago Exchange, or ArcaEx®, and the Pacific Exchange). NYSE Group is a leading provider of securities listing, trading and market data products and services. The New York Mercantile Exchange, Inc. (NYMEX) is the world’s largest physical commodity futures exchange and the preeminent trading forum for energy and precious metals, with trading conducted through two divisions – the NYMEX Division, home to the energy, platinum, and palladium markets, and the COMEX Division, on which all other metals trade. Additional risks are associated with international investing, such as currency fluctuations, political and economic instability and differences in accounting standards. This material represents an assessment of the market environment at a specific point in time and is not intended to be a forecast of future events, or a guarantee of future results. MarketingPro, Inc. is not affiliated with any person or firm that may be providing this information to you. The publisher is not engaged in rendering legal, accounting or other professional services. If assistance is needed, the reader is advised to engage the services of a competent professional.
Citations.
1 – cnbc.com/2018/08/10/us-cpi-july-2018.html [8/10/18]
2 – reuters.com/article/us-usa-economy-inventories/u-s-producer-prices-unchanged-in-july-idUSKBN1KU1JH [8/9/18]
3 – factset.com/hubfs/Resources%20Section/Research%20Desk/Earnings%20Insight/EarningsInsight_081018.pdf [8/10/18]
4 – bloomberg.com/news/articles/2018-08-10/oil-set-for-sixth-weekly-loss-as-u-s-china-trade-war-escalates [8/10/18]
5 – thestreet.com/markets/stocks-slide-amid-currency-crisis-in-turkey-14679908 [8/10/18]
6 – markets.wsj.com/us [8/10/18]
7 – bigcharts.marketwatch.com/historical/default.asp?symb=DJIA&closeDate=8%2F10%2F17&x=0&y=0 [8/10/18]
7 – bigcharts.marketwatch.com/historical/default.asp?symb=COMP&closeDate=8%2F10%2F17&x=0&y=0 [8/10/18]
7 – bigcharts.marketwatch.com/historical/default.asp?symb=SPX&closeDate=8%2F10%2F17&x=0&y=0 [8/10/18]
7 – bigcharts.marketwatch.com/historical/default.asp?symb=DJIA&closeDate=8%2F9%2F13&x=0&y=0 [8/10/18]
7 – bigcharts.marketwatch.com/historical/default.asp?symb=COMP&closeDate=8%2F9%2F13&x=0&y=0 [8/10/18]
7 – bigcharts.marketwatch.com/historical/default.asp?symb=SPX&closeDate=8%2F9%2F13&x=0&y=0 [8/10/18]
7 – bigcharts.marketwatch.com/historical/default.asp?symb=DJIA&closeDate=8%2F11%2F08&x=0&y=0 [8/10/18]
7 – bigcharts.marketwatch.com/historical/default.asp?symb=COMP&closeDate=8%2F11%2F08&x=0&y=0 [8/10/18]
7 – bigcharts.marketwatch.com/historical/default.asp?symb=SPX&closeDate=8%2F11%2F08&x=0&y=0 [8/10/18]
8 – treasury.gov/resource-center/data-chart-center/interest-rates/Pages/TextView.aspx?data=realyield [8/10/18]
9 – treasury.gov/resource-center/data-chart-center/interest-rates/Pages/TextView.aspx?data=realyieldAll [8/10/18]
INFLATION AT 2.9%, CORE INFLATION AT 2.4%
Friday, the Department of Labor reported these annualized gains through July of this year for the Consumer Price Index. Both the headline and core CPIs rose 0.2% last month, matching the consensus forecast of economists polled by Reuters. The yearly core inflation increase is the largest on record since September 2008. (The core inflation reading leaves out food and energy costs.) The Producer Price Index was flat in July, with the yearly advance declining slightly to 3.4%; the core PPI rose 0.3%, resulting in a 2.8% annualized gain.(1,2)
HOW IS EARNINGS SEASON GOING?
Ninety-one percent of S&P 500 companies have reported Q2 results so far. FactSet, the respected stock market analytics firm, reports that 72% have surprised to the upside in terms of sales and 79% have topped earnings expectations. Weighing actual earnings results and future projections, FactSet estimates a 24.6% “blended” earnings growth rate for the second quarter. On Friday, the forward 12-month P/E ratio for the S&P 500 was 16.6; that compares to an average of 16.2 across the past five years.(3)
OIL FALLS FOR A SIXTH STRAIGHT WEEK
WTI crude last suffered such a losing streak in 2015. Friday, it settled at $67.63 on the NYMEX, even after a 1.2% advance during Friday’s trading session. Some commodities investors believe that the emerging trade war will reduce demand for energy products.(4)
NASDAQ ADVANCES, S&P AND DOW RETREAT
The possibility of the U.S. doubling tariffs on Turkish aluminum and steel sent stocks skidding worldwide, Friday, as diplomatic disagreements between the countries took on an economic aspect. Of the three major Wall Street indices, only the Nasdaq Composite posted a weekly gain, rising 0.35% to 7,839.11. The S&P 500 fell 0.25% in five days, settling at 2,833.28 Friday. The Dow Jones Industrial Average ended the week 0.59% lower at 25,313.14.(5,6)
THIS WEEK: Sysco announces Q2 results Monday. | Advance Auto Parts, Agilent Technologies, and Home Depot present earnings on Tuesday. | On Wednesday, July retail sales numbers are out, along with earnings from Briggs & Stratton and Cisco. | Nordstrom, Nvidia, and Walmart share quarterly results on Thursday, as Wall Street also considers new data on initial jobless claims and July homebuilding activity. | The University of Michigan’s initial August consumer sentiment index appears on Friday, plus the Conference Board’s latest leading indicators index and earnings from Deere & Co.
Indices are unmanaged, do not incur fees or expenses, and cannot be invested into directly. These returns do not include dividends. 10-year TIPS real yield = projected return at maturity given expected inflation.
This material was prepared by MarketingPro, Inc., and does not necessarily represent the views of the presenting party, nor their affiliates. The information herein has been derived from sources believed to be accurate. Please note – investing involves risk, and past performance is no guarantee of future results. Investments will fluctuate and when redeemed may be worth more or less than when originally invested. This information should not be construed as investment, tax or legal advice and may not be relied on for the purpose of avoiding any Federal tax penalty. This is neither a solicitation nor recommendation to purchase or sell any investment or insurance product or service, and should not be relied upon as such. All market indices discussed are unmanaged and are not illustrative of any particular investment. Indices do not incur management fees, costs and expenses, and cannot be invested into directly. All economic and performance data is historical and not indicative of future results. The Dow Jones Industrial Average is a price-weighted index of 30 actively traded blue-chip stocks. The NASDAQ Composite Index is a market-weighted index of all over-the-counter common stocks traded on the National Association of Securities Dealers Automated Quotation System. The Standard & Poor’s 500 (S&P 500) is a market-cap weighted index composed of the common stocks of 500 leading companies in leading industries of the U.S. economy. NYSE Group, Inc. (NYSE:NYX) operates two securities exchanges: the New York Stock Exchange (the “NYSE”) and NYSE Arca (formerly known as the Archipelago Exchange, or ArcaEx®, and the Pacific Exchange). NYSE Group is a leading provider of securities listing, trading and market data products and services. The New York Mercantile Exchange, Inc. (NYMEX) is the world’s largest physical commodity futures exchange and the preeminent trading forum for energy and precious metals, with trading conducted through two divisions – the NYMEX Division, home to the energy, platinum, and palladium markets, and the COMEX Division, on which all other metals trade. Additional risks are associated with international investing, such as currency fluctuations, political and economic instability and differences in accounting standards. This material represents an assessment of the market environment at a specific point in time and is not intended to be a forecast of future events, or a guarantee of future results. MarketingPro, Inc. is not affiliated with any person or firm that may be providing this information to you. The publisher is not engaged in rendering legal, accounting or other professional services. If assistance is needed, the reader is advised to engage the services of a competent professional.
Citations.
1 – cnbc.com/2018/08/10/us-cpi-july-2018.html [8/10/18]
2 – reuters.com/article/us-usa-economy-inventories/u-s-producer-prices-unchanged-in-july-idUSKBN1KU1JH [8/9/18]
3 – factset.com/hubfs/Resources%20Section/Research%20Desk/Earnings%20Insight/EarningsInsight_081018.pdf [8/10/18]
4 – bloomberg.com/news/articles/2018-08-10/oil-set-for-sixth-weekly-loss-as-u-s-china-trade-war-escalates [8/10/18]
5 – thestreet.com/markets/stocks-slide-amid-currency-crisis-in-turkey-14679908 [8/10/18]
6 – markets.wsj.com/us [8/10/18]
7 – bigcharts.marketwatch.com/historical/default.asp?symb=DJIA&closeDate=8%2F10%2F17&x=0&y=0 [8/10/18]
7 – bigcharts.marketwatch.com/historical/default.asp?symb=COMP&closeDate=8%2F10%2F17&x=0&y=0 [8/10/18]
7 – bigcharts.marketwatch.com/historical/default.asp?symb=SPX&closeDate=8%2F10%2F17&x=0&y=0 [8/10/18]
7 – bigcharts.marketwatch.com/historical/default.asp?symb=DJIA&closeDate=8%2F9%2F13&x=0&y=0 [8/10/18]
7 – bigcharts.marketwatch.com/historical/default.asp?symb=COMP&closeDate=8%2F9%2F13&x=0&y=0 [8/10/18]
7 – bigcharts.marketwatch.com/historical/default.asp?symb=SPX&closeDate=8%2F9%2F13&x=0&y=0 [8/10/18]
7 – bigcharts.marketwatch.com/historical/default.asp?symb=DJIA&closeDate=8%2F11%2F08&x=0&y=0 [8/10/18]
7 – bigcharts.marketwatch.com/historical/default.asp?symb=COMP&closeDate=8%2F11%2F08&x=0&y=0 [8/10/18]
7 – bigcharts.marketwatch.com/historical/default.asp?symb=SPX&closeDate=8%2F11%2F08&x=0&y=0 [8/10/18]
8 – treasury.gov/resource-center/data-chart-center/interest-rates/Pages/TextView.aspx?data=realyield [8/10/18]
9 – treasury.gov/resource-center/data-chart-center/interest-rates/Pages/TextView.aspx?data=realyieldAll [8/10/18]
